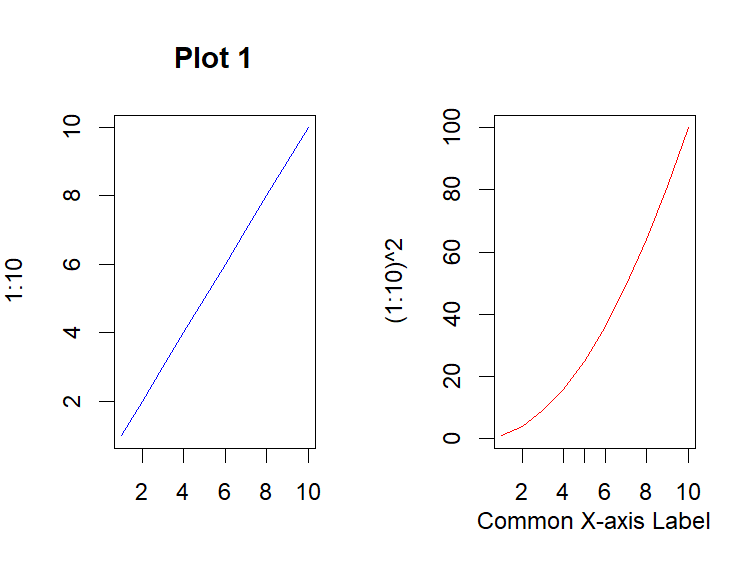
I'm trying to plot two plots side by side using base R.
I'd like them to share the title and the x-axis and y-axis label. However, the range of the plots is different, so I want to keep the number of the labels.
I've seen that there are some solutions using par(), however, they seem overly complex.
I tried the following solution using layout():
dev.off()
# Create a layout with two plots

layout(matrix(c(1, 2), nrow = 1))

# Create the first plot
plot(1:10, 1:10, main = "Plot 1", type = "l", col = "blue", xlab = "")

# Create the second plot without the x-axis
plot(1:10, (1:10)^2, main = "", type = "l", col = "red", xlab = "")

# Draw the x-axis in the middle of the two plots
axis(side = 1, at = 5, labels = FALSE)

# Add labels to the x-axis if needed
mtext("Common X-axis Label", side = 1, line = 2)

# Reset the layout
layout(1)
However I cant get the x-axis label and the main title to the center of the plot? Any ideas on how to do this?
I've tried to use the line = 2 to put the x-axis label in the center of the two plots.
Now it looks like this:


