layer_scales not detecting all breaks from ggplot
Asked Answered
B

2

5

Given the following plot:

library(tidyverse)
p <- ggplot(mtcars, aes(drat, disp)) +
  geom_line()
p
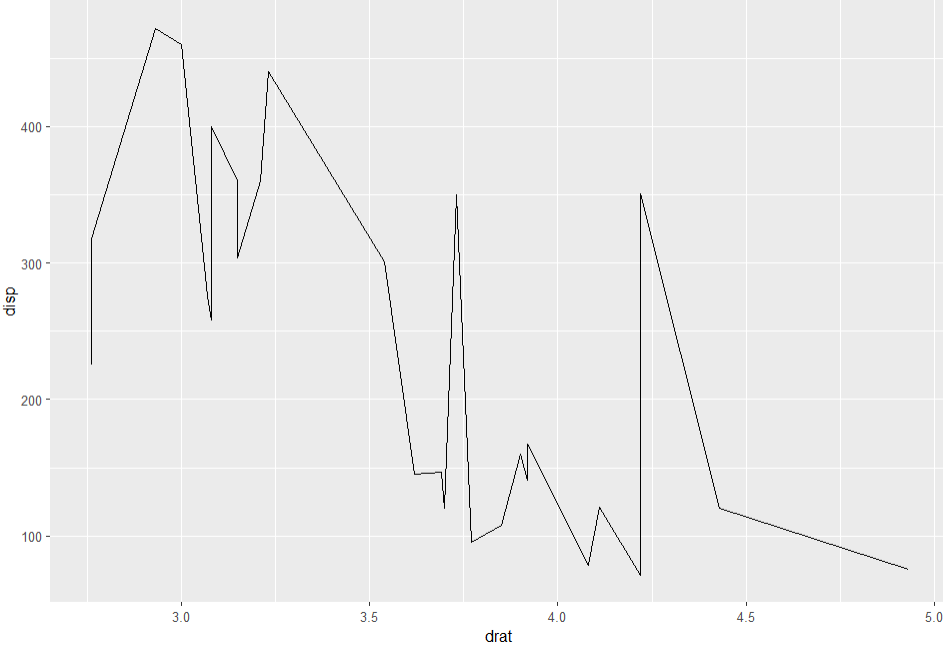
enter image description here layer_scales can be used (here) to extract breaks/break positions from most ggplot objects like the one above e.g.

# layer_scales(p)$y$get_breaks()
as.numeric(na.omit(layer_scales(p)$y$break_positions()))
# [1] 100 200 300 400
# returns exactly the breaks that are in the plot

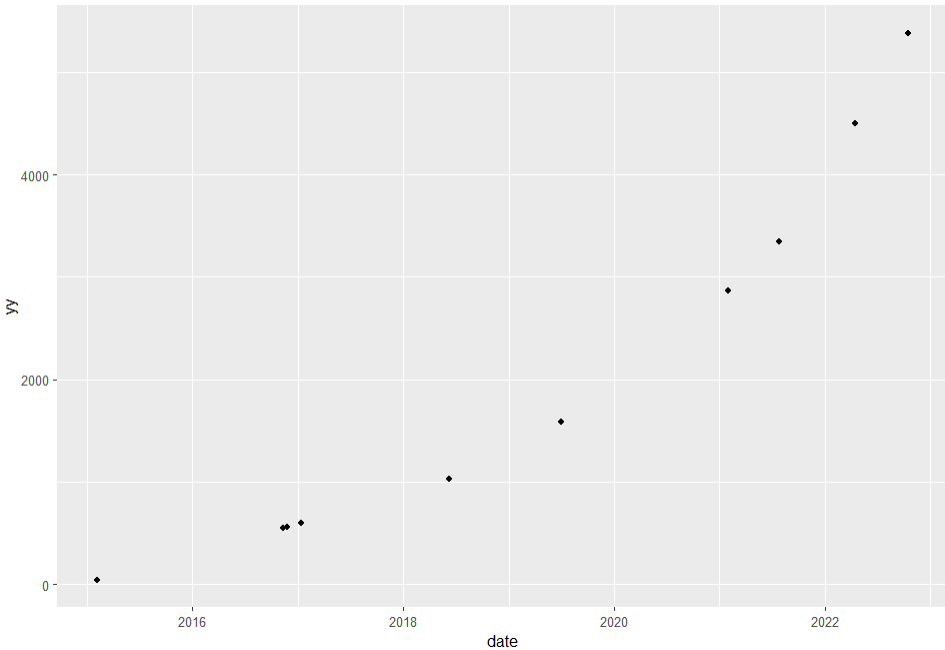
But when I try to extract the ones from this plot, it doesn't work

df <- structure(list(date = structure(c(18080, 19281, 19096, 17178, 
                                        17692, 18659, 17129, 17114, 18833, 16472), class = "Date"), yy = c(1589L, 
                                                                                                           5382L, 4504L, 595L, 1027L, 2864L, 556L, 549L, 3346L, 42L)), class = "data.frame", row.names = c(NA, 
                                                                                                                                                                                                           -10L))
df
p1 <- ggplot(df, aes(x = date, y = yy)) +
  geom_point() 
p1

enter image description here

layer_scales(p1)$y$get_breaks()
# [1]    0 1000 2000 3000 4000 5000
as.numeric(na.omit(layer_scales(p1)$y$break_positions()))
# [1] 1000 2000 3000 4000 5000
# it doesn't return 0 2000 4000

Any idea why layer_scales is not working in this case?

Burthen answered 24/10, 2024 at 18:52 Comment(2)
I posted an answer (well, workaround). I will award a bounty when this is eligible for one, either to reward an existing answer which explains why layer_scale() doesn't work or to draw more attention to your question. This is an interesting one. Cheers.Mota
thanks for the answer below. Stumped as to why layer_scales doesn't work though, I wondered had it something to do with using a date variable and some scaling issue (although that is in the other axis so probably not!). I will use your approach for now.Burthen
F
3

The other answer given here is a perfectly reasonable work-around. As for why it happens, the answer is a bit complicated.


Explanation

The object returned from layer_scales(p1)$y is a ggproto object of class ScaleContinuousPosition which has been trained on the plotting data. However, it is not quite the final scale object that is used to generate the y axis in a ggplot. There is the extra step of turning it into a final, immutable scale object of class ViewScale. The main difference is that this has additionally been trained on the range and limits of the plot's co-ordinate system (including the co-ordinate expansion).

What is happening in your second plot is that the expansion of the y axis to pretty limits above and below the range of your data is causing the y co-ordinate range to expand:

range(df$yy)
#> [1]   42 5382

ggplot_build(p1)$layout$panel_params[[1]]$y.range
#> [1] -225 5649

This expanded range is being used as the basis for creating new breaks in the function ggplot2:::view_scales_from_scales, which creates a ViewScale object from the existing scale object using the function ggplot2:::view_scale_primary

ggplot2:::view_scale_primary(layer_scales(p1)$y, c(-225, 5649))$get_breaks()
#> [1]    0 2000 4000   NA

The NA value is discarded, leaving you with the breaks you see on the plot.


Solution

The suggestion in the answer by @M-- of doing:

as.numeric(na.omit(ggplot_build(p1)$layout$panel_params[[1]]$y$get_breaks()))

works because it accesses the finalized ViewScale objects that are stored in the layout$panel_params member of the "ggplot_built" object created by ggplot_build(), rather than the trained but unfinished scale objects that are stored in the layout$panel_scales_x and layout$panel_scales_y of the "ggplot_built" object - these are what is returned by layer_scales().

However, you might want a little wrapper function to replace layer_scales if you don't want to have to write this complex line of code each time:

get_plot_breaks <- function(plot) {
  
  params <- ggplot_build(plot)$layout$panel_params[[1]]
  
  list(x = c(na.omit(params$x$get_breaks())), 
       y = c(na.omit(params$y$get_breaks())))
}

This allows the accurate capture of the breaks as drawn on the plot itself:

get_plot_breaks(p1)
#> $x
#>  2016  2018  2020  2022 
#> 16801 17532 18262 18993 
#>
#> $y
#> [1]    0 2000 4000
Fae answered 7/11, 2024 at 16:4 Comment(3)
I wish I had pinged you sooner so you'd have gotten the bounty :) Thank youMota
thank you, great insights as always. Would you say that behaviour was by design? It almost seems (layer_scales(p1)$y) is pointless or is there some use for that its output?Burthen
@Burthen the docs suggest that layer_scales() is used for testing, and the objects it produces can be tinkered with and used over. From the SO questions I have seen that use layer_scales(), must folks use it to extract breaks from a plot object, but that probably wasn't the main motivation behind the function's creation. Something like get_plot_breaks might be a useful addition to ggplot, though its output should probably be a per-panel list to handle facets.Fae
M
4

I am not quite sure why layer_scale() does not work for p1, but ggplot_build(p)$layout$panel_params[[1]]$y$get_breaks() works for both plots:

library(ggplot2)

df <- structure(list(date = structure(c(18080, 19281, 19096, 17178, 17692, 
                                        18659, 17129, 17114, 18833, 16472), 
                                      class = "Date"), 
                     yy = c(1589L, 5382L, 4504L, 595L, 1027L, 
                            2864L, 556L, 549L, 3346L, 42L)), 
                class = "data.frame", row.names = c(NA, -10L))

p <- ggplot(mtcars, aes(drat, disp)) +
  geom_line()

p1 <- ggplot(df, aes(x = date, y = yy)) +
  geom_point() 


as.numeric(na.omit(ggplot_build(p)$layout$panel_params[[1]]$y$get_breaks()))
#> [1] 100 200 300 400

as.numeric(na.omit(ggplot_build(p1)$layout$panel_params[[1]]$y$get_breaks()))
#> [1]    0 2000 4000

Created on 2024-10-24 with reprex v2.0.2

Mota answered 24/10, 2024 at 19:13 Comment(0)
F
3

The other answer given here is a perfectly reasonable work-around. As for why it happens, the answer is a bit complicated.


Explanation

The object returned from layer_scales(p1)$y is a ggproto object of class ScaleContinuousPosition which has been trained on the plotting data. However, it is not quite the final scale object that is used to generate the y axis in a ggplot. There is the extra step of turning it into a final, immutable scale object of class ViewScale. The main difference is that this has additionally been trained on the range and limits of the plot's co-ordinate system (including the co-ordinate expansion).

What is happening in your second plot is that the expansion of the y axis to pretty limits above and below the range of your data is causing the y co-ordinate range to expand:

range(df$yy)
#> [1]   42 5382

ggplot_build(p1)$layout$panel_params[[1]]$y.range
#> [1] -225 5649

This expanded range is being used as the basis for creating new breaks in the function ggplot2:::view_scales_from_scales, which creates a ViewScale object from the existing scale object using the function ggplot2:::view_scale_primary

ggplot2:::view_scale_primary(layer_scales(p1)$y, c(-225, 5649))$get_breaks()
#> [1]    0 2000 4000   NA

The NA value is discarded, leaving you with the breaks you see on the plot.


Solution

The suggestion in the answer by @M-- of doing:

as.numeric(na.omit(ggplot_build(p1)$layout$panel_params[[1]]$y$get_breaks()))

works because it accesses the finalized ViewScale objects that are stored in the layout$panel_params member of the "ggplot_built" object created by ggplot_build(), rather than the trained but unfinished scale objects that are stored in the layout$panel_scales_x and layout$panel_scales_y of the "ggplot_built" object - these are what is returned by layer_scales().

However, you might want a little wrapper function to replace layer_scales if you don't want to have to write this complex line of code each time:

get_plot_breaks <- function(plot) {
  
  params <- ggplot_build(plot)$layout$panel_params[[1]]
  
  list(x = c(na.omit(params$x$get_breaks())), 
       y = c(na.omit(params$y$get_breaks())))
}

This allows the accurate capture of the breaks as drawn on the plot itself:

get_plot_breaks(p1)
#> $x
#>  2016  2018  2020  2022 
#> 16801 17532 18262 18993 
#>
#> $y
#> [1]    0 2000 4000
Fae answered 7/11, 2024 at 16:4 Comment(3)
I wish I had pinged you sooner so you'd have gotten the bounty :) Thank youMota
thank you, great insights as always. Would you say that behaviour was by design? It almost seems (layer_scales(p1)$y) is pointless or is there some use for that its output?Burthen
@Burthen the docs suggest that layer_scales() is used for testing, and the objects it produces can be tinkered with and used over. From the SO questions I have seen that use layer_scales(), must folks use it to extract breaks from a plot object, but that probably wasn't the main motivation behind the function's creation. Something like get_plot_breaks might be a useful addition to ggplot, though its output should probably be a per-panel list to handle facets.Fae

© 2022 - 2025 — McMap. All rights reserved.