JFreeChart - XYBarChart Show Separate Bars for Each Series
Asked Answered
U

1

5

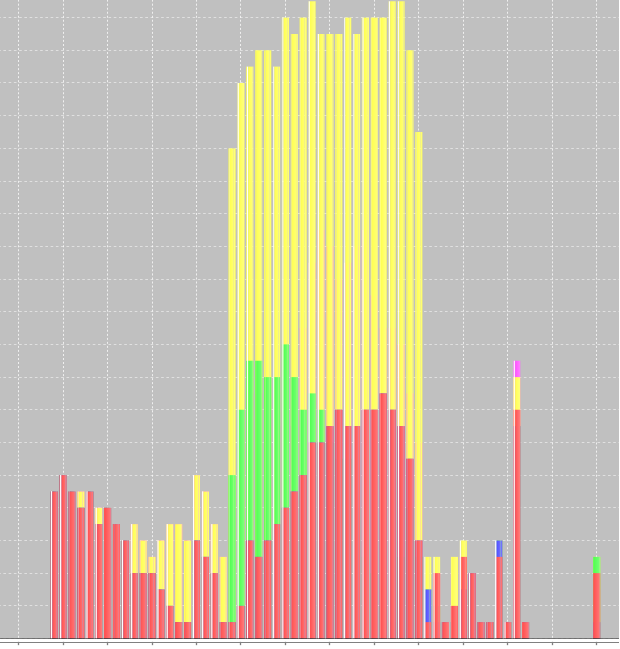
I'm creating a XYBarChart using JFreeChart and adding multiple series to it. Currently for a given x-value and different Y-values from the series, all of them are getting stacked on top of each other.

Would be possible to show each series as a different bar for a given x-value?

Edit: I'm posting the relevant section of my code that is used to create the chart for your reference.

Note that I cannot use CategoryDataset because this does not provide zooming capabilities on the Domain Axis. This is an essential requirement for my implementation.

XYSeriesCollection intervalXYDataSet  = new XYSeriesCollection();
int countPlotPoints = populateBandData(intervalXYDataSet, optionList); //optionList is a HashMap<Integer,ArrayList<Integer>> where key = seriesKey, and ArrayList<Integer> builds up the value for each series

if (countPlotPoints == 0) {
    print("No options selected.\n");
    JOptionPane.showMessageDialog(this, "No Plot Points Were Selected!", "Warning", JOptionPane.WARNING_MESSAGE);
    return;
}

/**
 * Chart Creation Section
 */
JFreeChart chart = ChartFactory.createXYBarChart(tabTitle, "Frequency Bands", false, "rxlev", intervalXYDataSet, PlotOrientation.VERTICAL, true, true, false);
XYPlot plot = (XYPlot) chart.getPlot();
plot.getRangeAxis().setStandardTickUnits(NumberAxis.createIntegerTickUnits());
plot.getDomainAxis().setAutoRange(true);

//        
final XYBarRenderer renderer = (XYBarRenderer) plot.getRenderer();
renderer.setDrawBarOutline(false);
renderer.setShadowVisible(false);
renderer.setMargin(0.2);
renderer.setDefaultShadowsVisible(false);

ChartPanel chartpanel = new ChartPanel(chart);
chartpanel.setDefaultDirectoryForSaveAs(new File(lastAnalyzedPath));

JFrame frame = new JFrame();
frame.setTitle(plotTitle);
frame.add(new JScrollPane(chartpanel));
frame.pack();
frame.setVisible(true);

frame.addWindowListener(new java.awt.event.WindowAdapter() {
    @Override
    public  void windowClosing(java.awt.event.WindowEvent evt) {
        try {
            System.out.println(":: Clearning Memory ::");
            System.out.println("\tFree Memory (Before cleanup): "+Runtime.getRuntime().freeMemory());
            Component component = getComponent(0);
            if(component instanceof ChartPanel){
                JFreeChart chart = ((ChartPanel) component).getChart();
                XYPlot plot = (XYPlot) chart.getPlot();
                plot        = null;
                chart       = null;
                component   = null;
            }
        } finally {
            System.runFinalization();
            System.gc();
            System.out.println("\tFree Memory (Post cleanup): "+Runtime.getRuntime().freeMemory());
        }
    }
});

Here's a screenshot of how it's currently appearing
Unworthy answered 6/7, 2012 at 17:9 Comment(2)
Is your code using XYBarRenderer, not StackedXYBarRenderer?. Can you please post the code that creates the bar chart?.Drab
@sperumal: just updated my post. is this helpful?Unworthy
D
8

EDIT Use ClusteredXYBarRenderer instead of XYBarRenderer. This draws adjacent bars (instead of StackedBars) and provides zooming capabilities.

There is no factory method in ChartFactory to create ClusteredXYBarRenderer.

Use the below method to create the Bar Chart.

private static JFreeChart createClusteredChart(String title, String categoryAxisLabel, String valueAxisLabel, IntervalXYDataset dataset) {

  NumberAxis domainAxis = new NumberAxis(categoryAxisLabel);
  domainAxis.setAutoRangeIncludesZero(false);

  ValueAxis valueAxis = new NumberAxis(valueAxisLabel);

  XYBarRenderer renderer = new ClusteredXYBarRenderer();

  XYPlot plot = new XYPlot(dataset, domainAxis, valueAxis, renderer);
  plot.setOrientation(PlotOrientation.VERTICAL);

  JFreeChart chart = new JFreeChart(title, JFreeChart.DEFAULT_TITLE_FONT, plot, true);

  return chart;
}

XYBarRenderer that you are using is correct. But I think you should use CategoryDataSet instead of XYSeriesCollection. Try using below dataset instead of XYSeriesCollection. This will produce adjacent bars instead of stacked bars.

private static CategoryDataset createDataset() {
  String series1 = "First";
  String series2 = "Second";
  String series3 = "Third";

  String category1 = "Category 1";
  String category2 = "Category 2";
  String category3 = "Category 3";
  String category4 = "Category 4";
  String category5 = "Category 5";

  DefaultCategoryDataset dataset = new DefaultCategoryDataset();

  dataset.addValue(1.0D, series1, category1);
  dataset.addValue(4.0D, series1, category2);
  dataset.addValue(3.0D, series1, category3);
  dataset.addValue(5.0D, series1, category4);
  dataset.addValue(5.0D, series1, category5);

  dataset.addValue(5.0D, series2, category1);
  dataset.addValue(7.0D, series2, category2);
  dataset.addValue(6.0D, series2, category3);
  dataset.addValue(8.0D, series2, category4);
  dataset.addValue(4.0D, series2, category5);

  dataset.addValue(4.0D, series3, category1);
  dataset.addValue(3.0D, series3, category2);
  dataset.addValue(2.0D, series3, category3);
  dataset.addValue(3.0D, series3, category4);
  dataset.addValue(6.0D, series3, category5);

  return dataset;
}
Drab answered 6/7, 2012 at 19:19 Comment(4)
The problem using CategoryDataset is that it does not provide zooming capabilities for the Domain axis. This is a very important requirement for my implementation :(Unworthy
That sounds fantastic. I'll try using this technique for time series bar charts.Politesse
to use CategoryDataset I have to change Plot implementation could you please tell me how can I change it ?Exenterate
Use a DefaultTableXYDataset with multiple XYSeries added to it as dataset parameter for the createClusteredChart method instead of the CategoryDataset which won't work.Affairs

© 2022 - 2024 — McMap. All rights reserved.