3D plots in Python
Asked Answered
J

3

5

How could I plot the following data in 3 dimensions? (apparently, there are more than that!)

data = [[10, 10, 0.84496124031007758],
        [10, 20, 0.87209302325581395],
        [10, 30, 0.88139534883720927],
        [20, 10, 0.86201550387596892],
        [20, 20, 0.87441860465116272],
        [20, 30, 0.88992248062015500],
        [30, 10, 0.87984496124031009],
        [30, 20, 0.89922480620155043],
        [30, 30, 0.92015503875968996]]
Jerryjerrybuild answered 9/10, 2013 at 19:23 Comment(0)
A
8

what kind of plot are you trying to get? Try this for a scatter plot. I'm also assuming your data is listed in x,y,z lists in your question.

import matplotlib.pyplot as plt
from mpl_toolkits.mplot3d import Axes3D

x, y, z = zip(*data)

fig = plt.figure()
ax = fig.add_subplot(111, projection='3d')
ax.scatter(x,y,z)
plt.show()
Andraandrade answered 9/10, 2013 at 19:47 Comment(0)
H
0

You can also use DataMelt http://jwork.org/dmelt. You can parse this file in pythonic way as in the previous example ANF than use HPlot or HPlotJa or SPlot java classes to visualize the data. You can also export to Esp or pdf image files

Homelike answered 3/7, 2018 at 5:0 Comment(0)
K
0

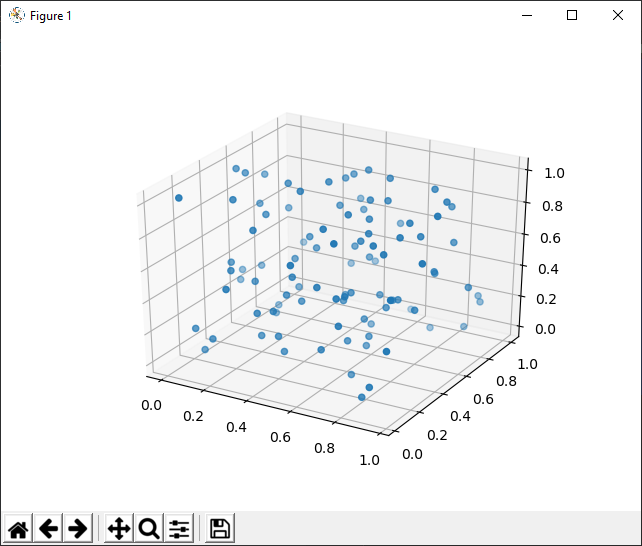
It's basicaly adding projection='3d' to your subplot.

import matplotlib.pyplot as plt
import numpy as np


fig = plt.figure() # create new figure
ax = fig.add_subplot(projection='3d') # add 3d plot

n = 100 # number of points

# random points
x = np.random.rand(n)
y = np.random.rand(n)
z = np.random.rand(n)

# make and show plot
ax.scatter(x, y, z)
plt.show()

With ax.scatter you can configure points markers, color and others.

Looks like the figure enter image description here

Korea answered 29/12, 2020 at 8:42 Comment(0)

© 2022 - 2024 — McMap. All rights reserved.