Subset data frame based on top N most frequent values in variable
Asked Answered
C

3

5

My objective is to create a simple density or barplot of a long dataframe which shows the relative frequency of nationalities in a course (MOOC). I just don't want all of the nationalities in there, just the top 10. I created this example df below + the ggplot2 code I use for plotting.

d=data.frame(course=sample(LETTERS[1:5], 500,replace=T),nationality=as.factor(sample(1:172,500,replace=T)))
mm <- ggplot(d, aes(x=nationality, colour=factor(course)))
mm + geom_bar() + theme_classic()

...but as said: I want a subset of the entire dataset based on frequency. The above shows all data.

PS. I added the ggplot2 code for context but also because maybe there is something within ggplot2 itself that would make this possible (I doubt it however).

EDIT 2014-12-11: The current answers use ddplyr or table methods to arrive at the desired subset, but I wonder if there is not a more direct way to achieve the same.. I will let it stay for now, see if there are other ways.

Calvo answered 11/12, 2014 at 11:51 Comment(1)
Regarding your 'PS' and 'EDIT': It is generally much easier to first prepare the data frame using your data massage tools of choice, then call ggplot. This Q&A, which is similar to your case, is one of many examples of that. Cheers.Alburga
A
5

Using dplyr functions count and top_n to get top-10 nationalities. Because top_n accounts for ties, the number of nationalities included in this example are more than 10 due to ties. arrange the counts, use factor and levels to set nationalities in descending order.

# top-10 nationalities
d2 <- d %>%
  count(nationality) %>%
  top_n(10) %>%
  arrange(n, nationality) %>%
  mutate(nationality = factor(nationality, levels = unique(nationality)))

d %>%
  filter(nationality %in% d2$nationality) %>%
  mutate(nationality = factor(nationality, levels = levels(d2$nationality))) %>%
  ggplot(aes(x = nationality, fill = course)) +
    geom_bar()

enter image description here

Alburga answered 11/12, 2014 at 12:57 Comment(1)
thanks a lot. Just this afternoon I was looking into dplyr but realized I did not have the time to dive into it. Seems like q nice syntax, will look into it later.Calvo
M
3

Here's an approach to select the top 10 nationalities. Note that multiple nationalities share the same frequency. Therefore, selecting the top 10 results in omitting some nationalities with the same frequency.

# calculate frequencies
tab <- table(d$nationality)
# sort
tab_s <- sort(tab)
# extract 10 most frequent nationalities
top10 <- tail(names(tab_s), 10)
# subset of data frame
d_s <- subset(d, nationality %in% top10)
# order factor levels
d_s$nationality <- factor(d_s$nationality, levels = rev(top10))

# plot
ggplot(d_s, aes(x = nationality, fill = as.factor(course))) +
  geom_bar() + 
  theme_classic()

Note that I changed colour to fill since colour affects the colour of the border.

enter image description here

Mozellemozes answered 11/12, 2014 at 12:6 Comment(1)
this answer is more 'understandable' for me, but how would you order the ggplot results?Calvo
C
0

although the questions was raised some time ago, I propose two other solutions for the sake of completeness:

d_raw <- data.frame(
  course = sample(LETTERS[1:5], 500, replace = T),
  nationality = as.factor(sample(1:172, 500, replace=T))
)
  1. One using fct_lump_n() from the forcats package and filter()

     d1 <- d_raw %>% 
       mutate(nationality = fct_lump_n(
         f = nationality, 
         n = 10,
         ties.method = "first"
       )) %>% 
       filter(nationality != "Other")
    
     d1 %>% count(nationality, sort = TRUE)
    
     ggplot(d1, aes(x = nationality, fill = course)) + # factor() is not needed here.
       geom_bar() + 
       theme_classic()
    

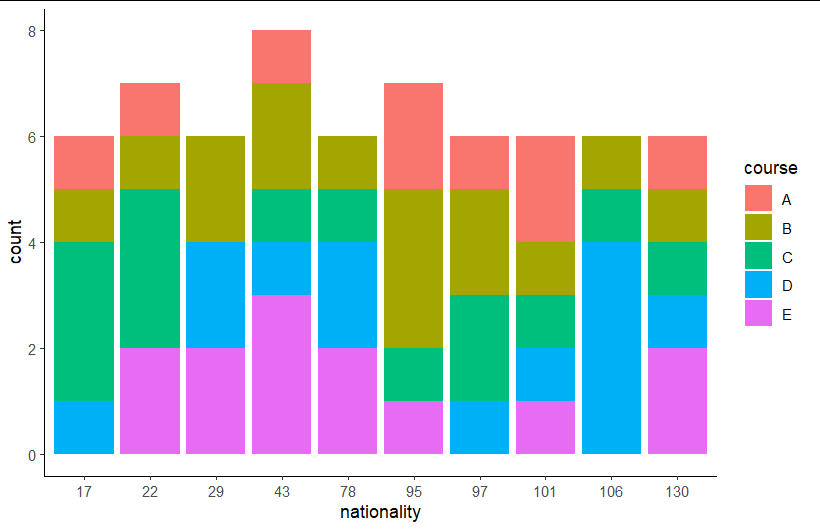
    fct_lump_n() summarises all nationalities except for the 10 most frequent ones to category "Other". Note that in fct_lump_n() argument ties.method = "first" is needed to really get only the first ten nationalities, not 11 or 12. All other nationalities are labeled "Other" even though they may appear just as often as the first ten nationalities.

    Levels of nationality are only ordered alphabetically.

    enter image description here

  2. Another solution is using fct_infreq() from the forcats package, cur_group_id() and filter().

     d2 <- d_raw %>% 
       group_by(nationality = fct_infreq(nationality)) %>% 
       filter(cur_group_id() <= 10) %>% 
       ungroup()
    
     d2 %>% count(nationality, sort = TRUE)
    
     ggplot(d2, aes(x = nationality, fill = course)) + # factor() is not needed here.
       geom_bar() + 
       theme_classic()
    

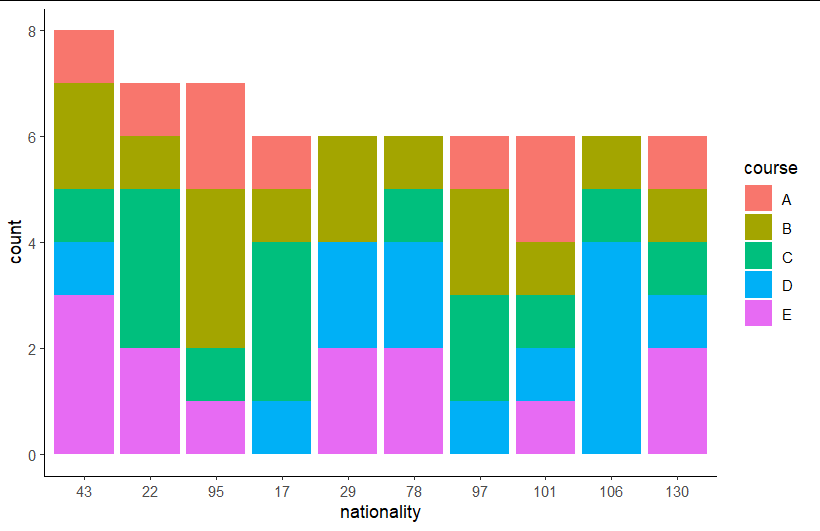
    cur_group_id() assigns a group ID to every nationality. To get started with the most frequent nationality we first need to order column nationality by its frequencies. Then we filter for the first ten group IDs aka the ten most frequent nationalities.

    Levels of nationality are first ordered by n, then ordered alphabetically.

I used count() to verify the two data frames d1 and d2 look the same. Both solutions have the advantage, that we don't need a second (temporary) data frame or temporary vectors.

I hope this helps someone in the future.

Clute answered 31/12, 2022 at 13:45 Comment(0)

© 2022 - 2024 — McMap. All rights reserved.