I know R has various ways to plot maps properly with projections. But just for a quick 'good enough' result using base functions, is there a function to calculate the aspect ratio for a particular latitude that if provided to R's typical asp arguments will approximate the right plot? i.e. Something equivalent to ggplot2's coord_quickmap method. Grateful for any suggestions.
Get aspect ratio for lat-long plots
Asked Answered
If what coord_quickmap provides is close enough for you, then you can do:
library(ggplot2)
library(maps)
library(mapdata)

# shamelessly stolen from coord_quickmap

map_aspect = function(x, y) {
  x.center <- sum(range(x)) / 2
  y.center <- sum(range(y)) / 2
  x.dist <- ggplot2:::dist_central_angle(x.center + c(-0.5, 0.5), rep(y.center, 2))
  y.dist <- ggplot2:::dist_central_angle(rep(x.center, 2), y.center + c(-0.5, 0.5))
  y.dist / x.dist
}
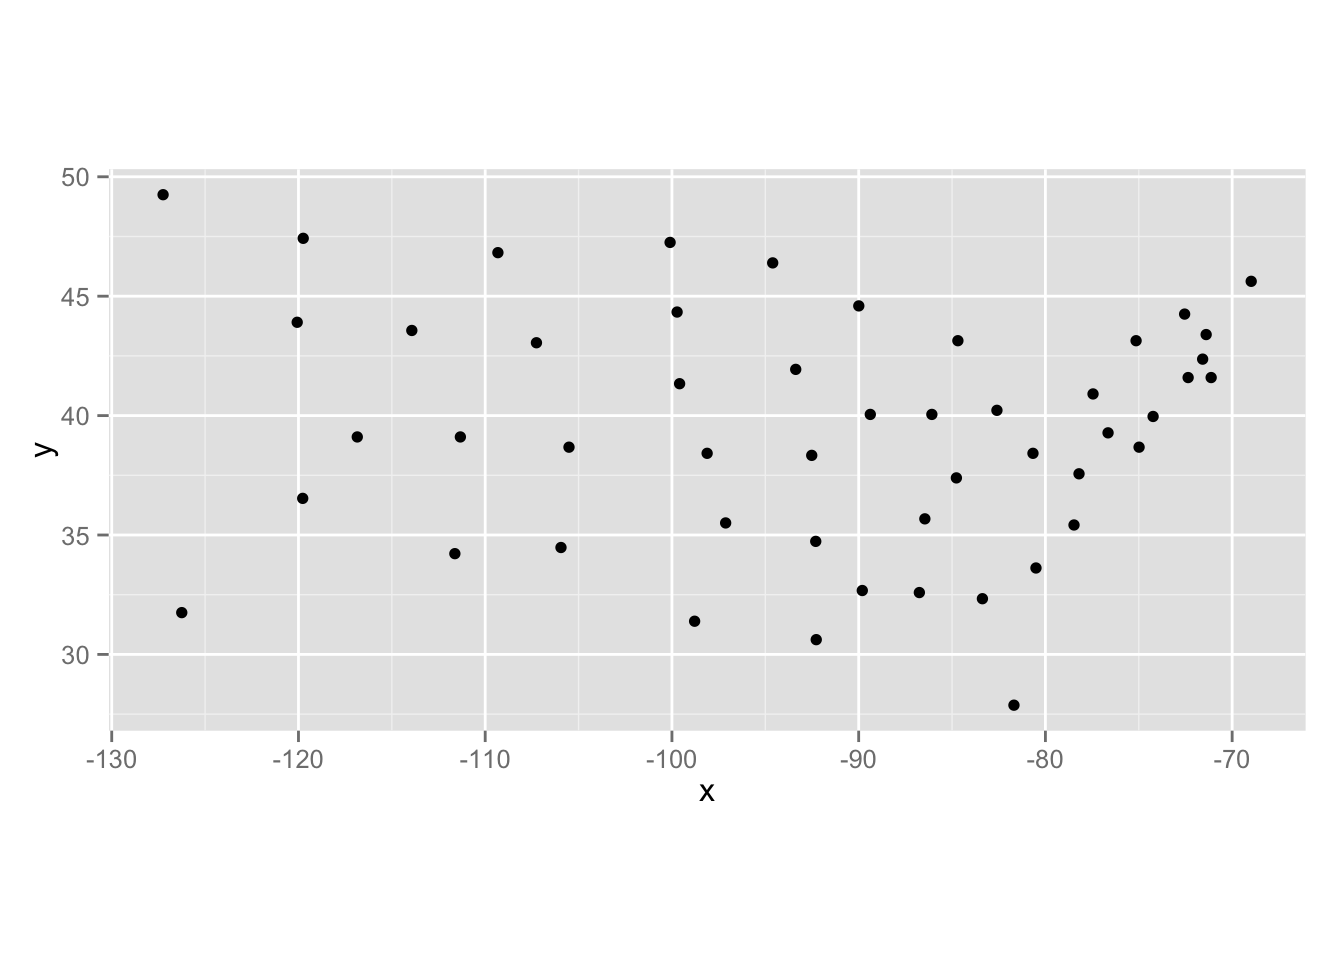
What ggplot would do:
ggplot(data.frame(state.center)) + geom_point(aes(x=x, y=y)) + coord_quickmap()
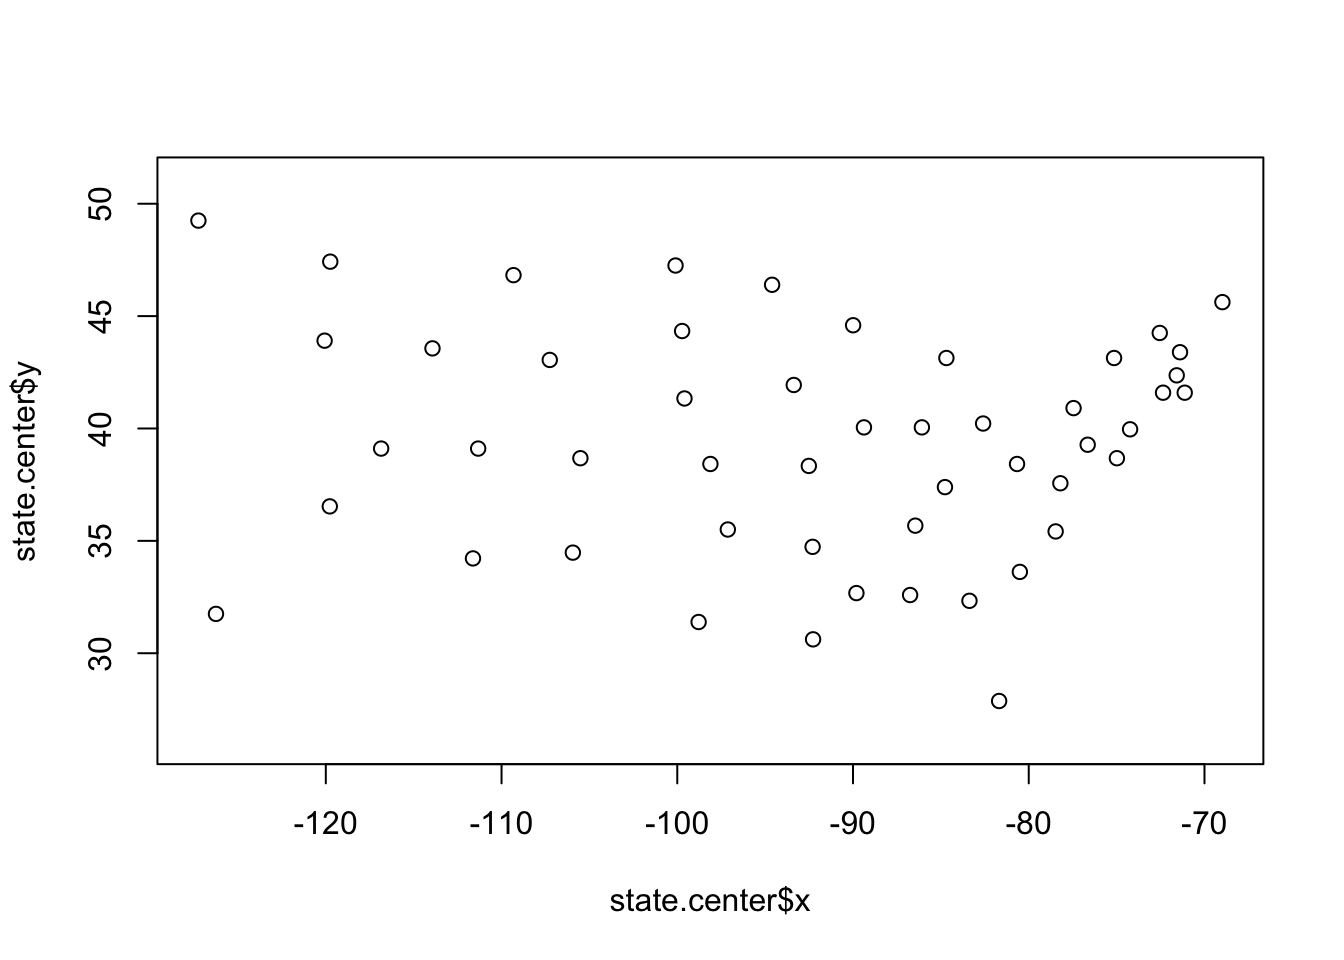
Same thing, now, in base:
plot(state.center$x, state.center$y,
     asp=map_aspect(state.center$x, state.center$y))
Remember, though, that coord_quickmap (and, hence, the calculated ratio from it) was designed for small areas. I post some resources for being able to pick map projections here: here which will work great with spTransform & base).
Spot on! Slightly confused why the longitude inputs are necessary but hey.
ggplot(data.frame(state.center)) + geom_point(aes(x=x, y=y)) + coord_fixed(ratio = ar) will demonstrate it's the exact same plot –
Smoothen © 2022 - 2024 — McMap. All rights reserved.


maps::mapwilluse a rectangular projection with the aspect ratio chosen so that longitude and latitude scales are equivalent at the center of the picture. Lemme post an example of how that's pretty much equivalent tocoord_quickmap. – Trigonplot(state.center$x, state.center$y, asp=1.6)– Smoothen