Build a Bar Chart from a List of Tuples - Python
Asked Answered
C

1

5

I need to build a bar chart from the list of tuples that I have got with key names as labels for each bar shown on the x axis, and values as heights of the bars. Here is how my input looks like:

top20 = [('Blues', 2008), ('Guadeloupe', 1894), ('Yorkshire', 1216), ('Monterrey', 1112), ('Government', 1081), ('Algeria', 972), ('Rotterdam', 920), ('Sardinia', 913), ('Mac OS', 864), ('Coffee', 858), ('Netherlands', 849), ('Oklahoma', 829), ('Tokyo', 817), ('Boating', 801), ('Finland', 765), ('Michigan', 737), ('Tamaulipas', 733), ('Croatia', 722), ('Kagoshima', 701), ('Isuzu', 678)]

Here is the code I am currently using:

plt.bar(range(len(top20)), top20.values(), align='center')
plt.xticks(range(len(top20)), list(top20.keys()))
plt.show()

I know, the logic follows a dictionary as an input, but I cannot think of a way to make this work. Please help, and thank you in advance.

Cambric answered 5/3, 2017 at 18:34 Comment(0)
A
8

You can convert your tupple list into list and use that:

plt.bar(range(len(top20)), [val[1] for val in top20], align='center')
plt.xticks(range(len(top20)), [val[0] for val in top20])
plt.xticks(rotation=70)
plt.show()

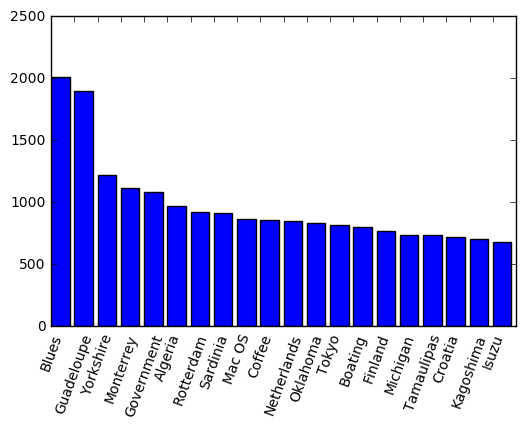
output: if you remove align='center' that is:

enter image description here

Update: [OP asked in comments]

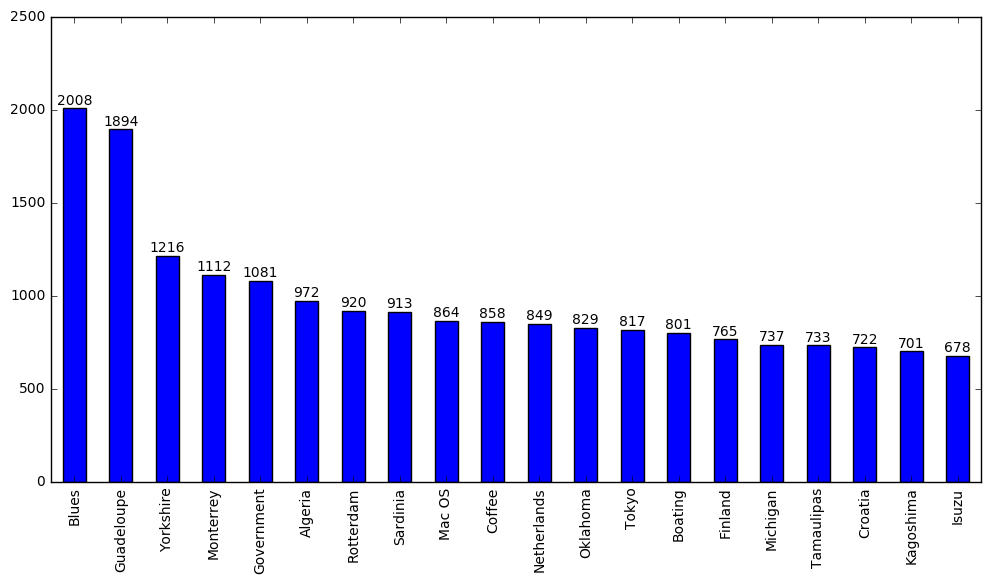
how would I add value labels to each bar to make the chart more comprehensive?

x_labels = [val[0] for val in top20]
y_labels = [val[1] for val in top20]
plt.figure(figsize=(12, 6))
ax = pd.Series(y_labels).plot(kind='bar')
ax.set_xticklabels(x_labels)

rects = ax.patches

for rect, label in zip(rects, y_labels):
    height = rect.get_height()
    ax.text(rect.get_x() + rect.get_width()/2, height + 5, label, ha='center', va='bottom')

output:

enter image description here

Also

dict(top20)

output:

{'Algeria': 972,
 'Blues': 2008,
 'Boating': 801,
 'Coffee': 858,
 'Croatia': 722,
 'Finland': 765,
 'Government': 1081,
 'Guadeloupe': 1894,
 'Isuzu': 678,
 'Kagoshima': 701,
 'Mac OS': 864,
 'Michigan': 737,
 'Monterrey': 1112,
 'Netherlands': 849,
 'Oklahoma': 829,
 'Rotterdam': 920,
 'Sardinia': 913,
 'Tamaulipas': 733,
 'Tokyo': 817,
 'Yorkshire': 1216}

will directly convert your tupple list to dictionary.

Approbation answered 5/3, 2017 at 18:38 Comment(5)
you are welcome @MaiiaS. Please tick/upvote if this solved your query :)Approbation
how would I add value labels to each bar to make the chart more comprehensive?Cambric
@MaiiaS. that's a little hard. let me figure that out.Approbation
@MaiiaS. I have added values on top of the bars. That's what you were looking for right ?Approbation
Vikash, you are amazing!! Thank you so-so much!Cambric

© 2022 - 2024 — McMap. All rights reserved.