Background:
Normally, R gives quantiles for well-known distributions. Out of these quantiles, the lower 2.5% up to the upper 97.5% covers 95% of the area under these distributions.
Question:
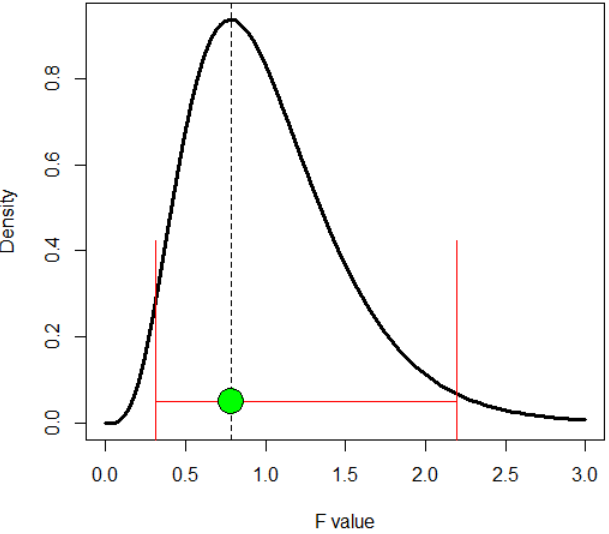
Suppose I have a F distribution (df1 = 10, df2 = 90). In R, how can I determine the 95% of the area under this distribution such that this 95% only covers the HIGH DENSITY area, not the 95% that R normally gives (see my R code Below)?
Note: Clearly, the highest density is the "mode" (dashed line in the pic below). So I guess, one must move from "mode" toward the tails.
Here is my R code:
curve(df(x, 10, 90), 0, 3, ylab = 'Density', xlab = 'F value', lwd = 3)

Mode = ( (10 - 2) / 10 ) * ( 90 / (90 + 2) )

abline(v = Mode, lty = 2)

CI = qf( c(.025, .975), 10, 90)

arrows(CI[1], .05, CI[2], .05, code = 3, angle = 90, length = 1.4, col= 'red' )

points(Mode, .05, pch = 21, bg = 'green', cex = 3)


