How to interpret GC Activity graph in JProfiler?
Asked Answered
J

2

5

Lately I've been working on optimizing some code (in compute time and max memory required). To know if there is potential gain to optimize memory cost, I use JProfiler. Typically

  • if it's high, I should try to reduce it globally
  • if it's spiky, I should try to reduce intermediate object creation

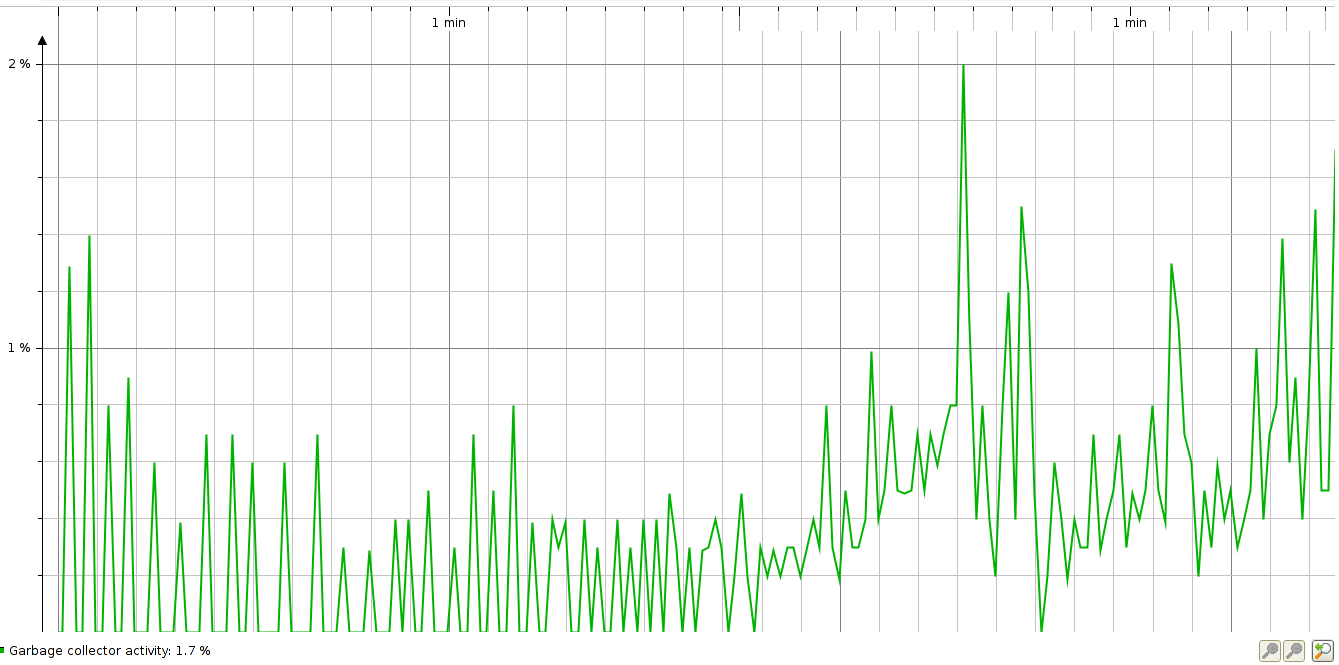
Now, I am in the second situation, and the GC Activity graph shows spikes but that are all less than 2% (see image below). How should I understand that ?

By default, my understanding is that the sum/integrale of the GC Activity curve is an estimate of the total percent of cpu used to collect data. So here that would mean much less than the max 2%

It that correct? Am I missing something?

enter image description here

Janik answered 28/9, 2017 at 11:14 Comment(3)
can you add an image? also, if you want more detailed GC interpretation of GC activity you should enable gc logging and run things through gcviewerGuttural
I've added an image. I am not aware of the gc logging functionalities, what does it do?Janik
gc logs provide more detailed statistics on overall GC performance. jprofiler is more suited for analyzing object graphs and allocation sites. so if you want to get a better impression of aggregate behavior then interpreting gc logs will provide more insight. if you want to know what is being allocated where then a profiler is the better choice.Guttural
G
3

By default, my understanding is that the sum/integrale of the GC Activity curve is an estimate of the total percent of cpu used to collect data.

It should be, yes.

So here that would mean much less than the max 2%

max is deceptive here. If you make your sampling interval small enough the maximum will be 100% of a time slice spent on GCing. That is when that slice is smaller than a GC pause duration. So those peaks are already averages over some larger time slices.

How should I understand that ?

That your application probably isn't spending much time on GC. But your graph only covers a relatively small amount of time, so it might not reflect major collections or concurrent cycles. Interpreting the JVM's GC logs will provide more details if you care about latency and not just throughput.

Guttural answered 28/9, 2017 at 13:3 Comment(1)
thanks for the answer. Here I am optimizing a piece of analytics code, pure calcul on one core. It is the same code that is called 1000s of times by the (distributed) application. I guess I'll look at gc logging when optimizing the apps. Note that strangely there are 2-behaviors (1st vs 2nd half) while the graph cover 8 iterative call to the same code, with only differences some input random values that should change only the result values, not what is computed.Janik
V
5

By default, my understanding is that the sum/integrale of the GC Activity curve is an estimate of the total percent of cpu used to collect data. So here that would mean much less than the max 2%

Is that correct?

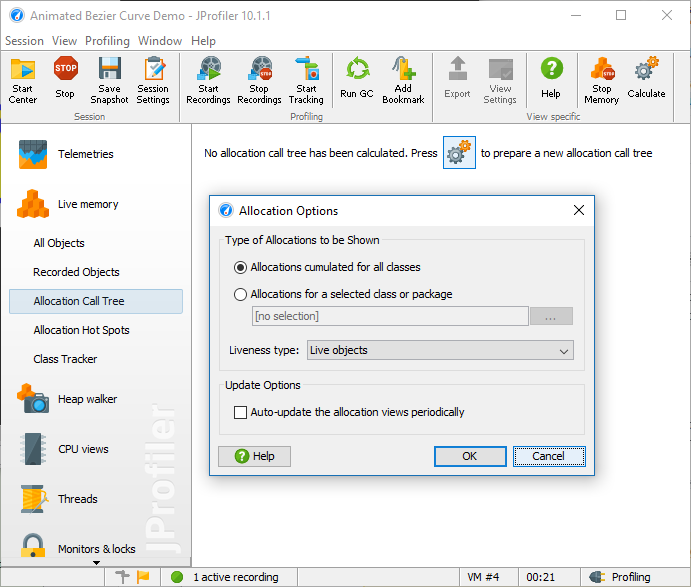
Yes, that's correct. If you want to find out where the temporary objects are allocated, go to Live Memory->Allocation Call Tree and choose "Garbage collected objects" as the liveness mode

enter image description here

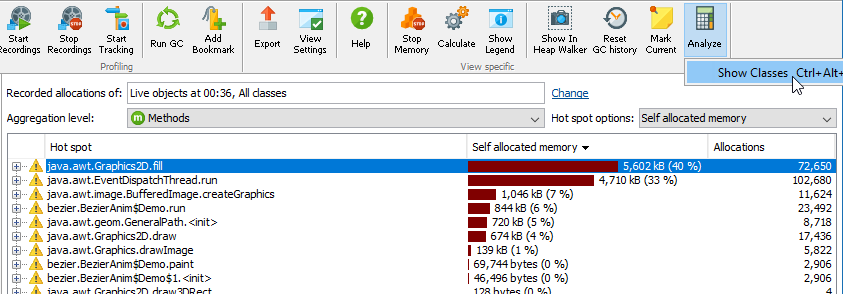
To see the classed in any allocation spot or allocation hot spot, use the "Show classes" call tree analysis.

enter image description here

Villar answered 28/9, 2017 at 14:51 Comment(0)
G
3

By default, my understanding is that the sum/integrale of the GC Activity curve is an estimate of the total percent of cpu used to collect data.

It should be, yes.

So here that would mean much less than the max 2%

max is deceptive here. If you make your sampling interval small enough the maximum will be 100% of a time slice spent on GCing. That is when that slice is smaller than a GC pause duration. So those peaks are already averages over some larger time slices.

How should I understand that ?

That your application probably isn't spending much time on GC. But your graph only covers a relatively small amount of time, so it might not reflect major collections or concurrent cycles. Interpreting the JVM's GC logs will provide more details if you care about latency and not just throughput.

Guttural answered 28/9, 2017 at 13:3 Comment(1)
thanks for the answer. Here I am optimizing a piece of analytics code, pure calcul on one core. It is the same code that is called 1000s of times by the (distributed) application. I guess I'll look at gc logging when optimizing the apps. Note that strangely there are 2-behaviors (1st vs 2nd half) while the graph cover 8 iterative call to the same code, with only differences some input random values that should change only the result values, not what is computed.Janik

© 2022 - 2024 — McMap. All rights reserved.