how to remove white lines from geom_tile (heat map) using ggplot2
Asked Answered
M

4

5

I am having trouble removing the white lines between tiles in my heat map. Below is my code and picture. Has anyone encountered this before?

t <- ggplot(Drug_heatmap_df_final, 
   aes(x=reorder(Drug,Total_Deaths), y=Start_Date, fill=Total_Deaths)) + 
   geom_tile() + 
   labs(title="Heatmap of Total Deaths per month by Drug", x="Drug", y="Month") + 
   theme(plot.title = element_text(hjust=.5)) +
   scale_y_date(date_breaks="1 year" , labels = date_format("%b-%Y")) +
   theme(axis.text.x = element_text(size=13)) 

plot(t)

enter image description here

Moffett answered 8/3, 2018 at 17:30 Comment(0)
W
5

I don't know if this is the most elegant solution but if you add color in your aes and then play with the size in geom_tile you can get them to overlap and remove the white lines:

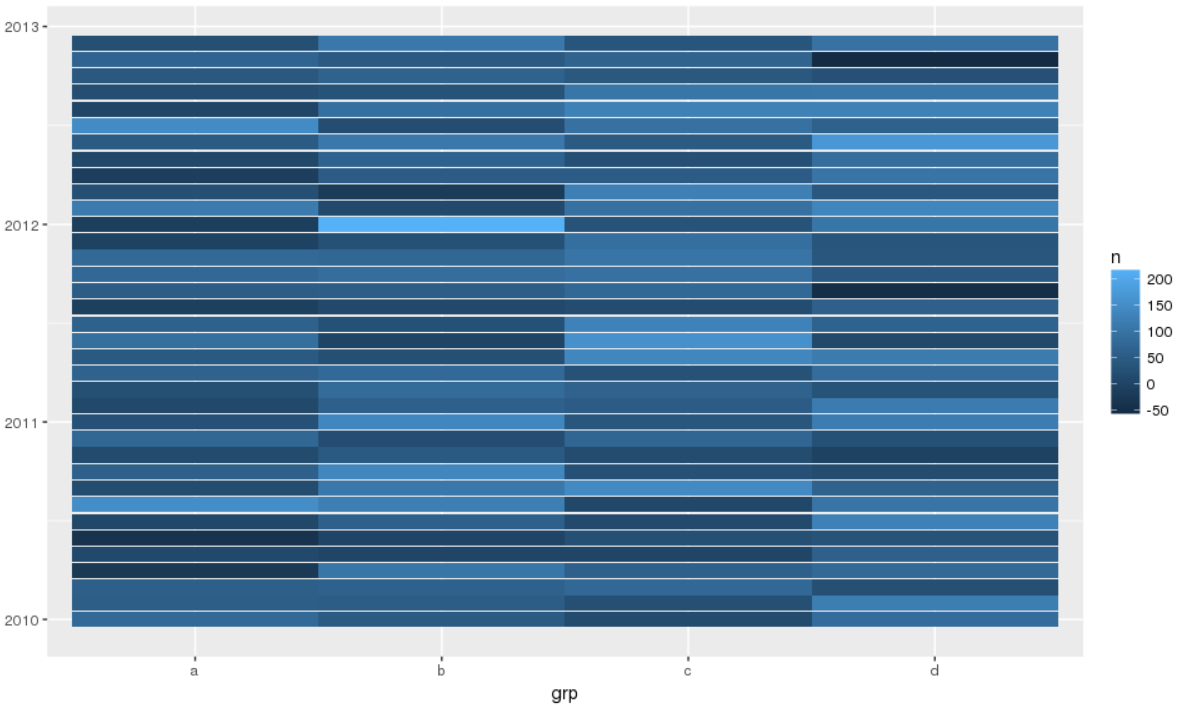
First is how my data looks with the white lines:

ggplot(mydf, aes(x=grp, y=date, fill=n)) + 
  geom_tile()

enter image description here

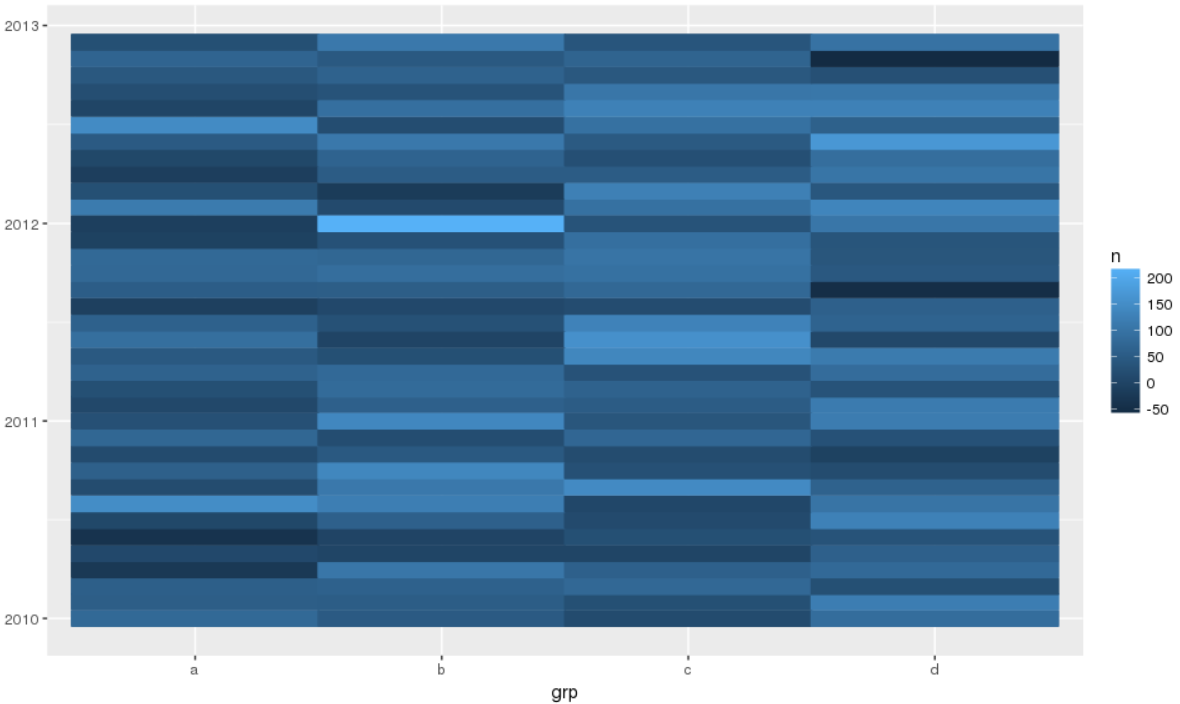
Now I set my color to the same object as my fill and mess with the size:

ggplot(mydf, aes(x=grp, y=date, fill=n,color=n)) + 
  geom_tile(size=0.6) 

enter image description here

Like I said, probably not the most elegant solution, and there is probably a better, more efficient way to determine the size value (instead of trial and error like I did) but in general this seems to solve your issue.

Wiggins answered 8/3, 2018 at 22:15 Comment(2)
This what exactly what I needed! I had also tried adding geom_raster() at the end of my code. It reduce the number of white lines from every row to 6 white lines throughout the whole plot, but I needed to remove all white lines. Your solution removed it all so thank you!Moffett
Using ggplot2 3.3.2, geom_tile(size= ...) didn't change anything for me. However, I have not dates on the y scale, but integers. What worked for me is geom_tile(height=1.01). The value is something slightly larger than the default, maybe the default is different for a date y scale. When the stripes are vertical geom_tile(width=...) can be used similarly.Waxbill
W
2

So I struggled with this same problem, unable to make my offending axis (a 24 hour period) discrete. In the end I realised that where I had plotted tiles every 2 minutes (1/30 of an hour), my csv data file had rounded the points up to 0.03 intervals, leaving gaps in between tiles, hence the white lines. I simply changed the number of decimal places in the excel sheet from 2 to many, giving 0.03333333 intervals and the white lines are gone. Horray! my heatmap before vs after

Wordless answered 15/2, 2020 at 10:31 Comment(0)
K
1

If you're plotting a continuous variable on both axes, and you're using geom_tile, you should consider using geom_raster instead. geom_raster removed the lines in my use case, and it's faster!

geom_raster requires each tile to be the same size, but that has often been sufficient in my experience. Check out the documentation here: https://ggplot2.tidyverse.org/reference/geom_tile.html

Karilynn answered 9/9, 2023 at 21:30 Comment(0)
V
0

better to add to the theme:

  • theme( panel.grid = element_blank() )
Vannie answered 29/2, 2024 at 10:5 Comment(0)

© 2022 - 2025 — McMap. All rights reserved.