How to use pykalman filter_update for online regression
Asked Answered
O

1

5

I want to use Kalman regression recursively on an incoming stream of price data using kf.filter_update() but I can't make it work. Here's the example code framing the problem:

The dataset (i.e. the stream):

DateTime             CAT      DOG
2015-01-02 09:01:00, 1471.24, 9868.76
2015-01-02 09:02:00, 1471.75, 9877.75
2015-01-02 09:03:00, 1471.81, 9867.70
2015-01-02 09:04:00, 1471.59, 9849.03
2015-01-02 09:05:00, 1471.45, 9840.15
2015-01-02 09:06:00, 1471.16, 9852.71
2015-01-02 09:07:00, 1471.30, 9860.24
2015-01-02 09:08:00, 1471.39, 9862.94

The data is read into a Pandas dataframe and the following code simulates the stream by iterating over the df:

df = pd.read_csv('data.txt')
df.dropna(inplace=True)

history = {}
history["spread"] = []
history["state_means"] = []
history["state_covs"] = []

for idx, row in df.iterrows():
    if idx == 0: # Initialize the Kalman filter
        delta = 1e-9
        trans_cov = delta / (1 - delta) * np.eye(2)
        obs_mat = np.vstack([df.iloc[0].CAT, np.ones(df.iloc[0].CAT.shape)]).T[:, np.newaxis]
        kf = KalmanFilter(n_dim_obs=1, n_dim_state=2,
                          initial_state_mean=np.zeros(2),
                          initial_state_covariance=np.ones((2, 2)),
                          transition_matrices=np.eye(2),
                          observation_matrices=obs_mat,
                          observation_covariance=1.0,
                          transition_covariance=trans_cov)

        state_means, state_covs = kf.filter(np.asarray(df.iloc[0].DOG))
        history["state_means"], history["state_covs"] = state_means, state_covs
        slope=state_means[:, 0]
        print "SLOPE", slope

    else:
        state_means, state_covs = kf.filter_update(history["state_means"][-1], history["state_covs"][-1], observation = np.asarray(df.iloc[idx].DOG))
        history["state_means"].append(state_means)
        history["state_covs"].append(state_covs)
        slope=state_means[:, 0]
        print "SLOPE", slope

The Kalman filter initializes properly and I get the first regression coefficient, but the subsequent updates throws an exception:

Traceback (most recent call last):
SLOPE [ 6.70319125]
  File "C:/Users/.../KalmanUpdate_example.py", line 50, in <module>
KalmanOnline(df)
  File "C:/Users/.../KalmanUpdate_example.py", line 43, in KalmanOnline
state_means, state_covs = kf.filter_update(history["state_means"][-1], history["state_covs"][-1], observation = np.asarray(df.iloc[idx].DOG))
  File "C:\Python27\Lib\site-packages\pykalman\standard.py", line 1253, in filter_update
2, "observation_matrix"
  File "C:\Python27\Lib\site-packages\pykalman\standard.py", line 38, in _arg_or_default
+ '  You must specify it manually.') % (name,)
ValueError: observation_matrix is not constant for all time.  You must specify it manually.

Process finished with exit code 1

It seems intuitively clear that the observation matrix is required (it's provided in the initial step, but not in the updating steps), but I cannot figure out how to set it up properly. Any feedback would be highly appreciated.

Ogdan answered 17/4, 2018 at 18:24 Comment(0)
T
8

Pykalman allows you to declare the observation matrix in two ways:

  • [n_timesteps, n_dim_obs, n_dim_obs] - once for the whole estimation

  • [n_dim_obs, n_dim_obs] - separately for each estimation step

In your code you used the first option (that's why "observation_matrix is not constant for all time"). But then you used filter_update in the loop and Pykalman could not understand what to use as the observation matrix in each iteration.

I would declare the observation matrix as a 2-element array:

from pykalman import KalmanFilter
import numpy as np
import pandas as pd
import matplotlib.pyplot as plt

df = pd.read_csv('data.txt')
df.dropna(inplace=True)

n = df.shape[0]
n_dim_state = 2;

history_state_means = np.zeros((n, n_dim_state))
history_state_covs = np.zeros((n, n_dim_state, n_dim_state))

for idx, row in df.iterrows():
    if idx == 0: # Initialize the Kalman filter
        delta = 1e-9
        trans_cov = delta / (1 - delta) * np.eye(2)

        obs_mat = [df.iloc[0].CAT, 1]

        kf = KalmanFilter(n_dim_obs=1, n_dim_state=2,
                          initial_state_mean=np.zeros(2),
                          initial_state_covariance=np.ones((2, 2)),
                          transition_matrices=np.eye(2),
                          observation_matrices=obs_mat,
                          observation_covariance=1.0,
                          transition_covariance=trans_cov)

        history_state_means[0], history_state_covs[0] = kf.filter(np.asarray(df.iloc[0].DOG))
        slope=history_state_means[0, 0]
        print "SLOPE", slope

    else:
        obs_mat = np.asarray([[df.iloc[idx].CAT, 1]])

        history_state_means[idx], history_state_covs[idx] = kf.filter_update(history_state_means[idx-1], 
                                                            history_state_covs[idx-1], 
                                                            observation = df.iloc[idx].DOG, 
                                                            observation_matrix=obs_mat)
        slope=history_state_means[idx, 0]
        print "SLOPE", slope

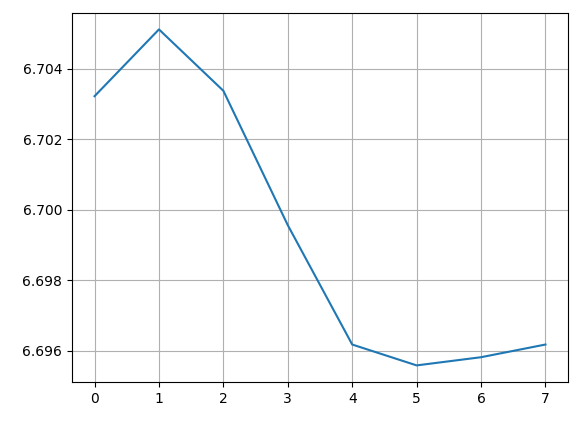
plt.figure(1)
plt.plot(history_state_means[:, 0], label="Slope")
plt.grid()
plt.show()

It results in the following output:

SLOPE 6.70322464199
SLOPE 6.70512037269
SLOPE 6.70337808649
SLOPE 6.69956406785
SLOPE 6.6961767953
SLOPE 6.69558438828
SLOPE 6.69581682668
SLOPE 6.69617670459

pykalman kalman filter online estimation of the regression parameters

The Pykalman is not really good documented and there are mistakes on the official page. That's why I recomend to test the result using the offline estimation in one step. In this case the observation matrix has to be declared as you did it in your code.

from pykalman import KalmanFilter
import numpy as np
import pandas as pd
import matplotlib.pyplot as plt

df = pd.read_csv('data.txt')
df.dropna(inplace=True)

delta = 1e-9
trans_cov = delta / (1 - delta) * np.eye(2)
obs_mat = np.vstack([df.iloc[:].CAT, np.ones(df.iloc[:].CAT.shape)]).T[:, np.newaxis]

kf = KalmanFilter(n_dim_obs=1, n_dim_state=2,
                  initial_state_mean=np.zeros(2),
                  initial_state_covariance=np.ones((2, 2)),
                  transition_matrices=np.eye(2),
                  observation_matrices=obs_mat,
                  observation_covariance=1.0,
                  transition_covariance=trans_cov)

state_means, state_covs = kf.filter(df.iloc[:].DOG)

print "SLOPE", state_means[:, 0]

plt.figure(1)
plt.plot(state_means[:, 0], label="Slope")
plt.grid()
plt.show()

The result is the same.

Townscape answered 18/4, 2018 at 22:55 Comment(1)
Anton, thanks a lot for the elaborate answer and taking your time to actually amend the code. Now it works as expected.Ogdan

© 2022 - 2024 — McMap. All rights reserved.