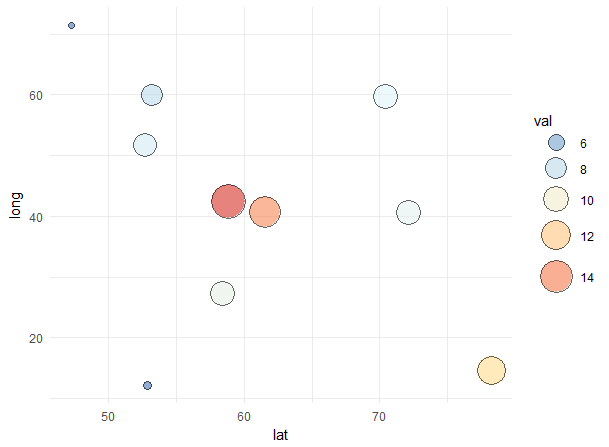
I'm plotting point data on a map and would like to scale point size and fill to another column. However, ggplot produces two separate legends for size and fill, where I only want one. I have looked at several answers to the same problem, e.g. this one, but cannot understand what I'm doing wrong. My understanding ist that if both aesthetics are mapped to the same data, there should only be one legend, correct?
Here's some code to illustrate the problem. Any help is much appreciated!
lat <- rnorm(10,54,12)
long <- rnorm(10,44,12)
val <- rnorm(10,10,3)

df <- as.data.frame(cbind(long,lat,val))

library(ggplot2)
library(scales)
ggplot() +
 geom_point(data=df,
            aes(x=lat,y=long,size=val,fill=val),
            shape=21, alpha=0.6) +
  scale_size_continuous(range = c(2, 12), breaks=pretty_breaks(4)) +
   scale_fill_distiller(direction = -1, palette="RdYlBu") +
    theme_minimal()


+ guides(…)is the key here: without that, the legends won’t be merged, and this really isn’t obvious. – Rasia