How to perform a joint fit of several curves (in Python)?
Asked Answered
E

2

5

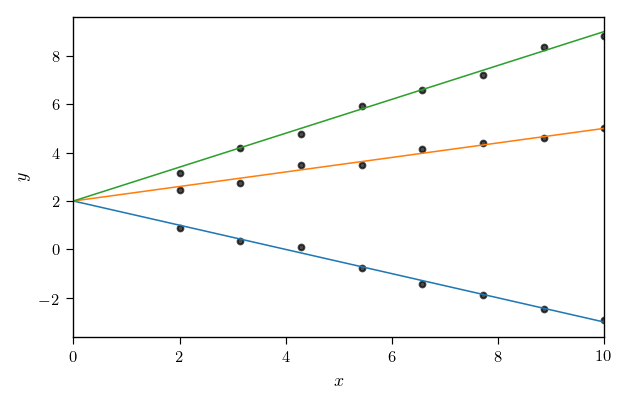
Suppose I'm fitting some data points by a simple linear regression. Now I'd like to perform several joint linear regressions for several sets of data points. More specifically, I want one parameter to be equal among all fits, which is schematically depicted here for the y-axis intersection.

y-axis intersection

After searching Google for some time I could neither find any Python (Scipy) routine which does that, nor any general literature, how one would accomplish this.

Ideally, I want to perform those joint fits not only in the case of simple linear regressions, but also for more general fit functions (for instance, power-law fits with joint exponent).

Earhart answered 11/12, 2018 at 16:44 Comment(0)
P
5

The lmfit module allows you to do this, as mentioned in their FAQ:

from lmfit import minimize, Parameters, fit_report
import numpy as np

# residual function to minimize
def fit_function(params, x=None, dat1=None, dat2=None):

    model1 = params['offset'] + x * params['slope1']
    model2 = params['offset'] + x * params['slope2']

    resid1 = dat1 - model1
    resid2 = dat2 - model2
    return np.concatenate((resid1, resid2))

# setup fit parameters
params = Parameters()
params.add('slope1', value=1)
params.add('slope2', value=-1)
params.add('offset', value=0.5)

# generate sample data
x = np.arange(0, 10)
slope1, slope2, offset = 1.1, -0.9, 0.2
y1 = slope1 * x + offset
y2 = slope2 * x + offset

# fit
out = minimize(residual, params, kws={"x": x, "dat1": y1, "dat2": y2})
print(fit_report(out))
# [[Fit Statistics]]
#     # fitting method   = leastsq
#     # function evals   = 9
#     # data points      = 20
#     # variables        = 3
#     chi-square         = 1.4945e-31
#     reduced chi-square = 8.7913e-33
#     Akaike info crit   = -1473.48128
#     Bayesian info crit = -1470.49408
# [[Variables]]
#     slope1:  1.10000000 +/- 8.2888e-18 (0.00%) (init = 1)
#     slope2: -0.90000000 +/- 8.2888e-18 (0.00%) (init = -1)
#     offset:  0.20000000 +/- 3.8968e-17 (0.00%) (init = 0.5)
# [[Correlations]] (unreported correlations are < 0.100)
#     C(slope1, offset) = -0.742
#     C(slope2, offset) = -0.742
#     C(slope1, slope2) =  0.551
Paphlagonia answered 11/12, 2018 at 17:36 Comment(1)
Easy, simple-to-use and exactly what I wanted!Earhart
D
3

I think this graphing code example does what you want, fitting two data sets with a single shared parameter. Note that if the data sets are of unequal length, that can effectively weight the fit toward the data set with more individual points. This example explicitly sets the initial parameter values to 1,0 - the curve_fit() defaults - and does not use scipy's genetic algorithm to help find initial parameter estimates.

import numpy as np
import matplotlib
import matplotlib.pyplot as plt
from scipy.optimize import curve_fit

y1 = np.array([ 16.00,  18.42,  20.84,  23.26])
y2 = np.array([-20.00, -25.50, -31.00, -36.50, -42.00])
comboY = np.append(y1, y2)

x1 = np.array([5.0, 6.1, 7.2, 8.3])
x2 = np.array([15.0, 16.1, 17.2, 18.3, 19.4])
comboX = np.append(x1, x2)

if len(y1) != len(x1):
    raise(Exception('Unequal x1 and y1 data length'))
if len(y2) != len(x2):
    raise(Exception('Unequal x2 and y2 data length'))


def function1(data, a, b, c): # not all parameters are used here, c is shared
        return a * data + c

def function2(data, a, b, c): # not all parameters are used here, c is shared
        return b * data + c


def combinedFunction(comboData, a, b, c):
    # single data reference passed in, extract separate data
    extract1 = comboData[:len(x1)] # first data
    extract2 = comboData[len(x1):] # second data

    result1 = function1(extract1, a, b, c)
    result2 = function2(extract2, a, b, c)

    return np.append(result1, result2)


# some initial parameter values
initialParameters = np.array([1.0, 1.0, 1.0])

# curve fit the combined data to the combined function
fittedParameters, pcov = curve_fit(combinedFunction, comboX, comboY, initialParameters)

# values for display of fitted function
a, b, c = fittedParameters

y_fit_1 = function1(x1, a, b, c) # first data set, first equation
y_fit_2 = function2(x2, a, b, c) # second data set, second equation

plt.plot(comboX, comboY, 'D') # plot the raw data
plt.plot(x1, y_fit_1) # plot the equation using the fitted parameters
plt.plot(x2, y_fit_2) # plot the equation using the fitted parameters
plt.show()

print('a, b, c:', fittedParameters)
Decrease answered 11/12, 2018 at 17:29 Comment(0)

© 2022 - 2024 — McMap. All rights reserved.