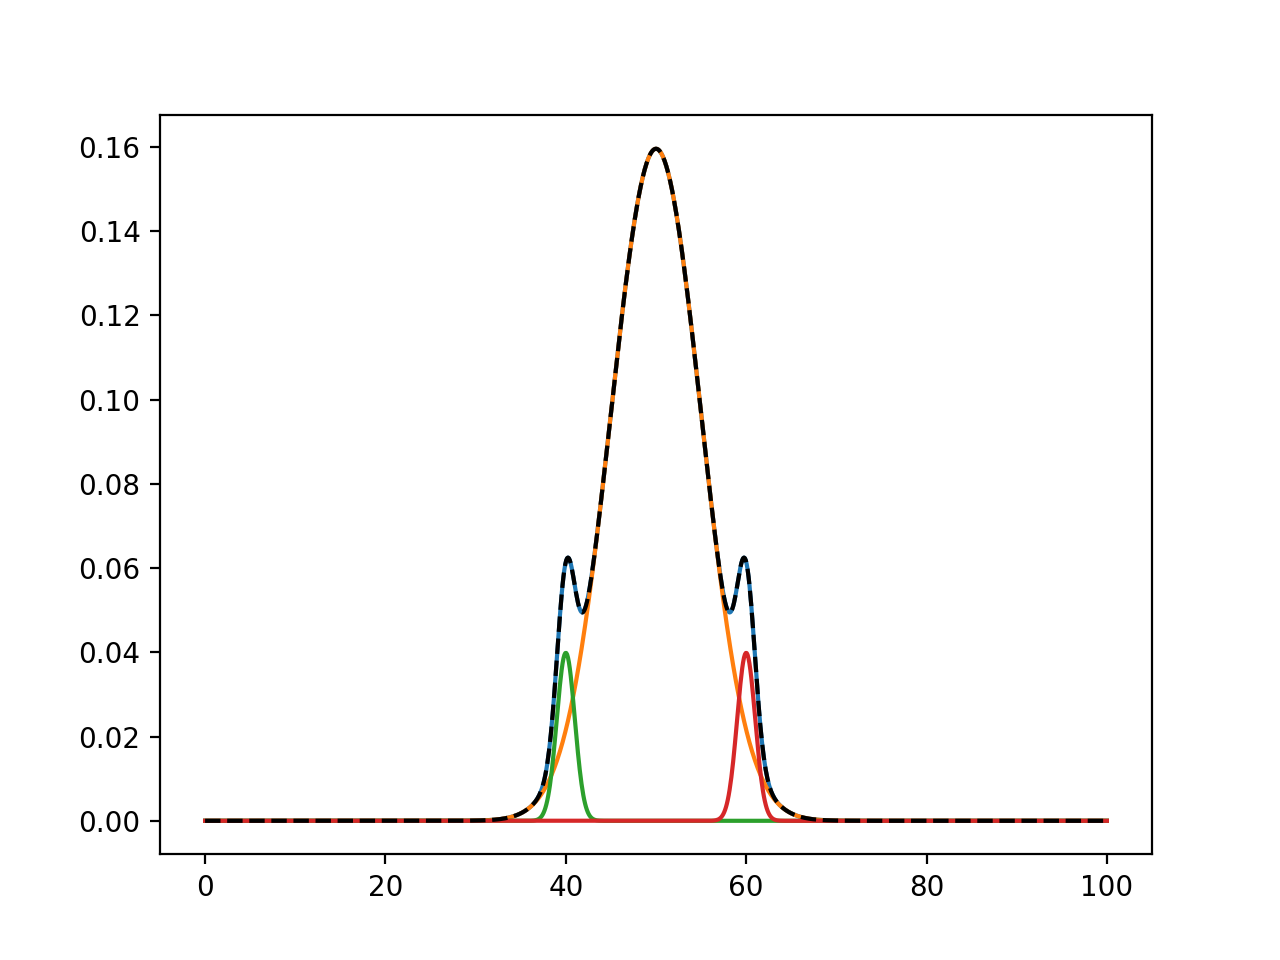
I am trying to deconvolve complex gas chromatogram signals into individual gaussian signals. Here is an example, where the dotted line represents the signal I am trying to deconvolve.
 I was able to write the code to do this using scipy.optimize.curve_fit; however, once applied to real data the results were unreliable. I believe being able to set bounds to my parameters will improve my results, so I am attempting to use lmfit, which allows this. I am having a problem getting lmfit to work with a variable number of parameters. The signals I am working with may have an arbitrary number of underlying gaussian components, so the number of parameters I need will vary. I found some hints here, but still can't figure it out...
Creating a python lmfit Model with arbitrary number of parameters
Here is the code I am currently working with. The code will run, but the parameter estimates do not change when the model is fit. Does anyone know how I can get my model to work?
import numpy as np
from collections import OrderedDict
from scipy.stats import norm
from lmfit import Parameters, Model

def add_peaks(x_range, *pars):
    y = np.zeros(len(x_range))
    for i in np.arange(0, len(pars), 3):
        curve = norm.pdf(x_range, pars[i], pars[i+1]) * pars[i+2]
        y = y + curve
    return(y)

# generate some fake data
x_range = np.linspace(0, 100, 1000)
peaks = [50., 40., 60.]
a = norm.pdf(x_range, peaks[0], 5) * 2
b = norm.pdf(x_range, peaks[1], 1) * 0.1
c = norm.pdf(x_range, peaks[2], 1) * 0.1
fake = a + b + c

param_dict = OrderedDict()

for i in range(0, len(peaks)):
    param_dict['pk' + str(i)] = peaks[i]
    param_dict['wid' + str(i)] = 1.
    param_dict['mult' + str(i)] = 1.

# In case, you'd like to see the plot of fake data
#y = add_peaks(x_range, *param_dict.values())
#plt.plot(x_range, y)
#plt.show()

# Initialize the model and fit
pmodel = Model(add_peaks)

params = pmodel.make_params()
for i in param_dict.keys():
    params.add(i, value=param_dict[i])

result = pmodel.fit(fake, params=params, x_range=x_range)
print(result.fit_report())

