How to profile the number of exceptions generated, categorized by exception class or line of code
Asked Answered
R

2

5

I'm using a number of open-source third-party libraries, and a flight recording shows that the code is generating tens of thousands of exceptions per second.

How can I track down which type of exception is being thrown, and where in the source code it's being thrown, so that I can see if I can fix the third-party code myself?

Java Mission Control does not show any breakdown of exception types or sources, as far as I can see.

Please do not recommend expensive commercial profilers, as this is for an open source project.

Renarenado answered 10/2, 2020 at 9:35 Comment(0)
G
6

Java Mission Control does not show any breakdown of exception types or sources, as far as I can see.

That is not correct, Java Mission Control does provide that information.

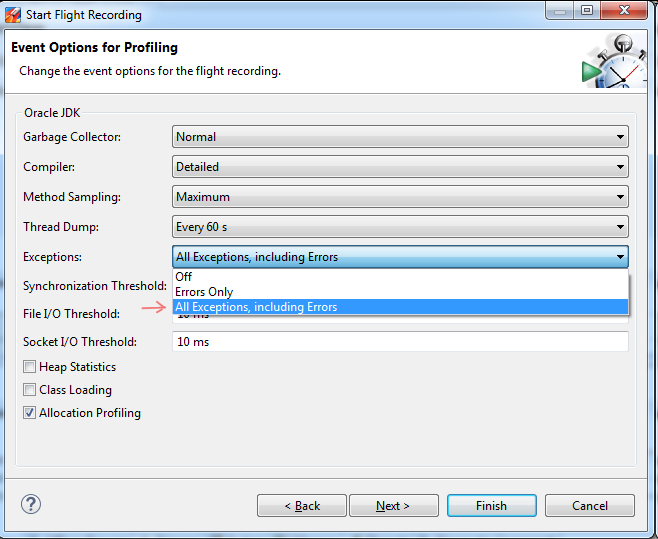
First you need to enabled tracing of exceptions in Flight Recorder (by default only java.lang.Error descendants are traced).

See flight recorder settings screen shot below.

Flight Recorder options

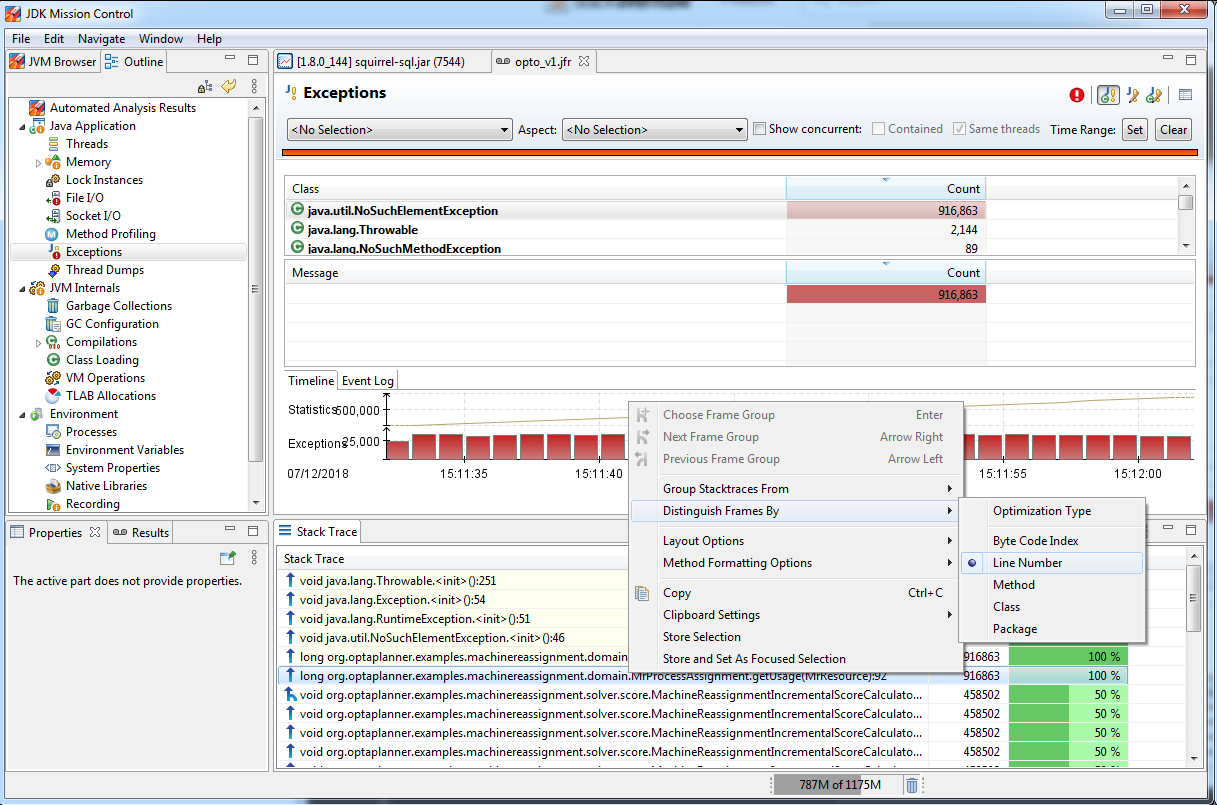
Once recorder you need to go to "Exceptions" report.

There you would find breakdown of exceptions by class. "Stack Trace" view would allow to get exact stack traces.

Mission Control

I little JMC live hack: bring context menu on "Stack Trace" view and select "Distinguish Frames By" > "Line Number" (see on screenshot above). That would allow you to see line numbers.

If you prefer CLI tools take a look at SJK (disclaimer, this is my own OSS profiler). E.g. command below would produce SVG flame graph of exceptions from you JFR dump. There are also few other report types.

java -jar sjk.jar ssa -f dump.jfr --jfr-event THROW --flame > throw_flame.svg
Gerius answered 10/2, 2020 at 15:20 Comment(2)
Thanks, great answer. I'm using command line collection, and it looks like I needed to set the jdk.JavaExceptionThrow option to true.Renarenado
Just a note for command line usage, you need to create a new settings file for JFR, similar to the ones included in the JDK (default and profile). You can either do this using JMC and export a file, or copy JDK/lib/jfr/profile.jfc and change jdk.JavaExceptionThrow#enabled to true. Then run your application with -XX:StartFlightRecording=settings=<path to the new file>......Forefinger
W
2

Please do not recommend expensive commercial profilers, as this is for an open source project.
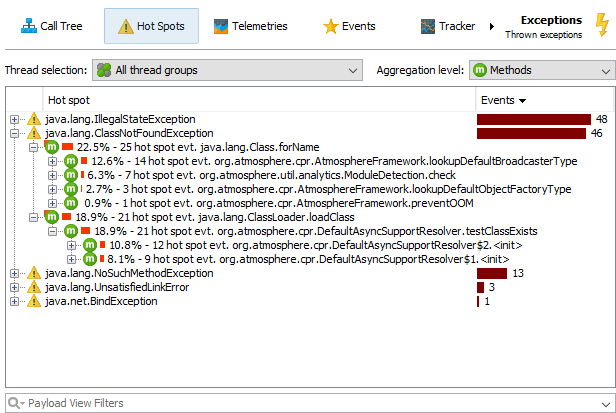
Some commercial profilers offer free licenses for open-source projects, like JProfiler.

In JProfiler, there is a probe that shows exceptions grouped by exception class with back traces to the call stacks where they were thrown.

enter image description here

Disclaimer: My company develops JProfiler.

Wheels answered 10/2, 2020 at 12:53 Comment(3)
Just a note that from Java 11, JFR is not a commercial feature anymore :)Forefinger
Also, note that since JMC 7, JMC is open sourced as part of OpenJDK. And since JMC 8, the source for JMC is available on GitHub: github.com/openjdk/jmcResolvent
Yes that is correct, my remark was regarding JProfiler, which is a commercial profiler. Btw, since 11.1 JProfiler can open JFR snapshots.Wheels

© 2022 - 2024 — McMap. All rights reserved.