Short answer:
Unfortunately, there’s no simple “for this given large memory allocation, it is associated with this particular UIImage”. You can use stack traces, either in Instruments’ “Allocations” tool or the Xcode “Debug memory graph” (with “malloc stack” feature), to identify what was allocated where, but it’s exceedingly difficult to use this to track from some large malloc for the image data and the original UIImage object. For simple objects it works fine, but it’s a little more convoluted for for images.
Long answer:
The challenge with images is that that often the memory allocated for the image data is somewhat decoupled from the UIImage object itself. The allocation of the UIImage object is easily tracked back to where you instantiated it, but not the buffer for the data backing the image. Worse, when we supply this image to some image view, the stack trace for that image buffer will drop you into rendering engine call tree, not your code, making it even harder.
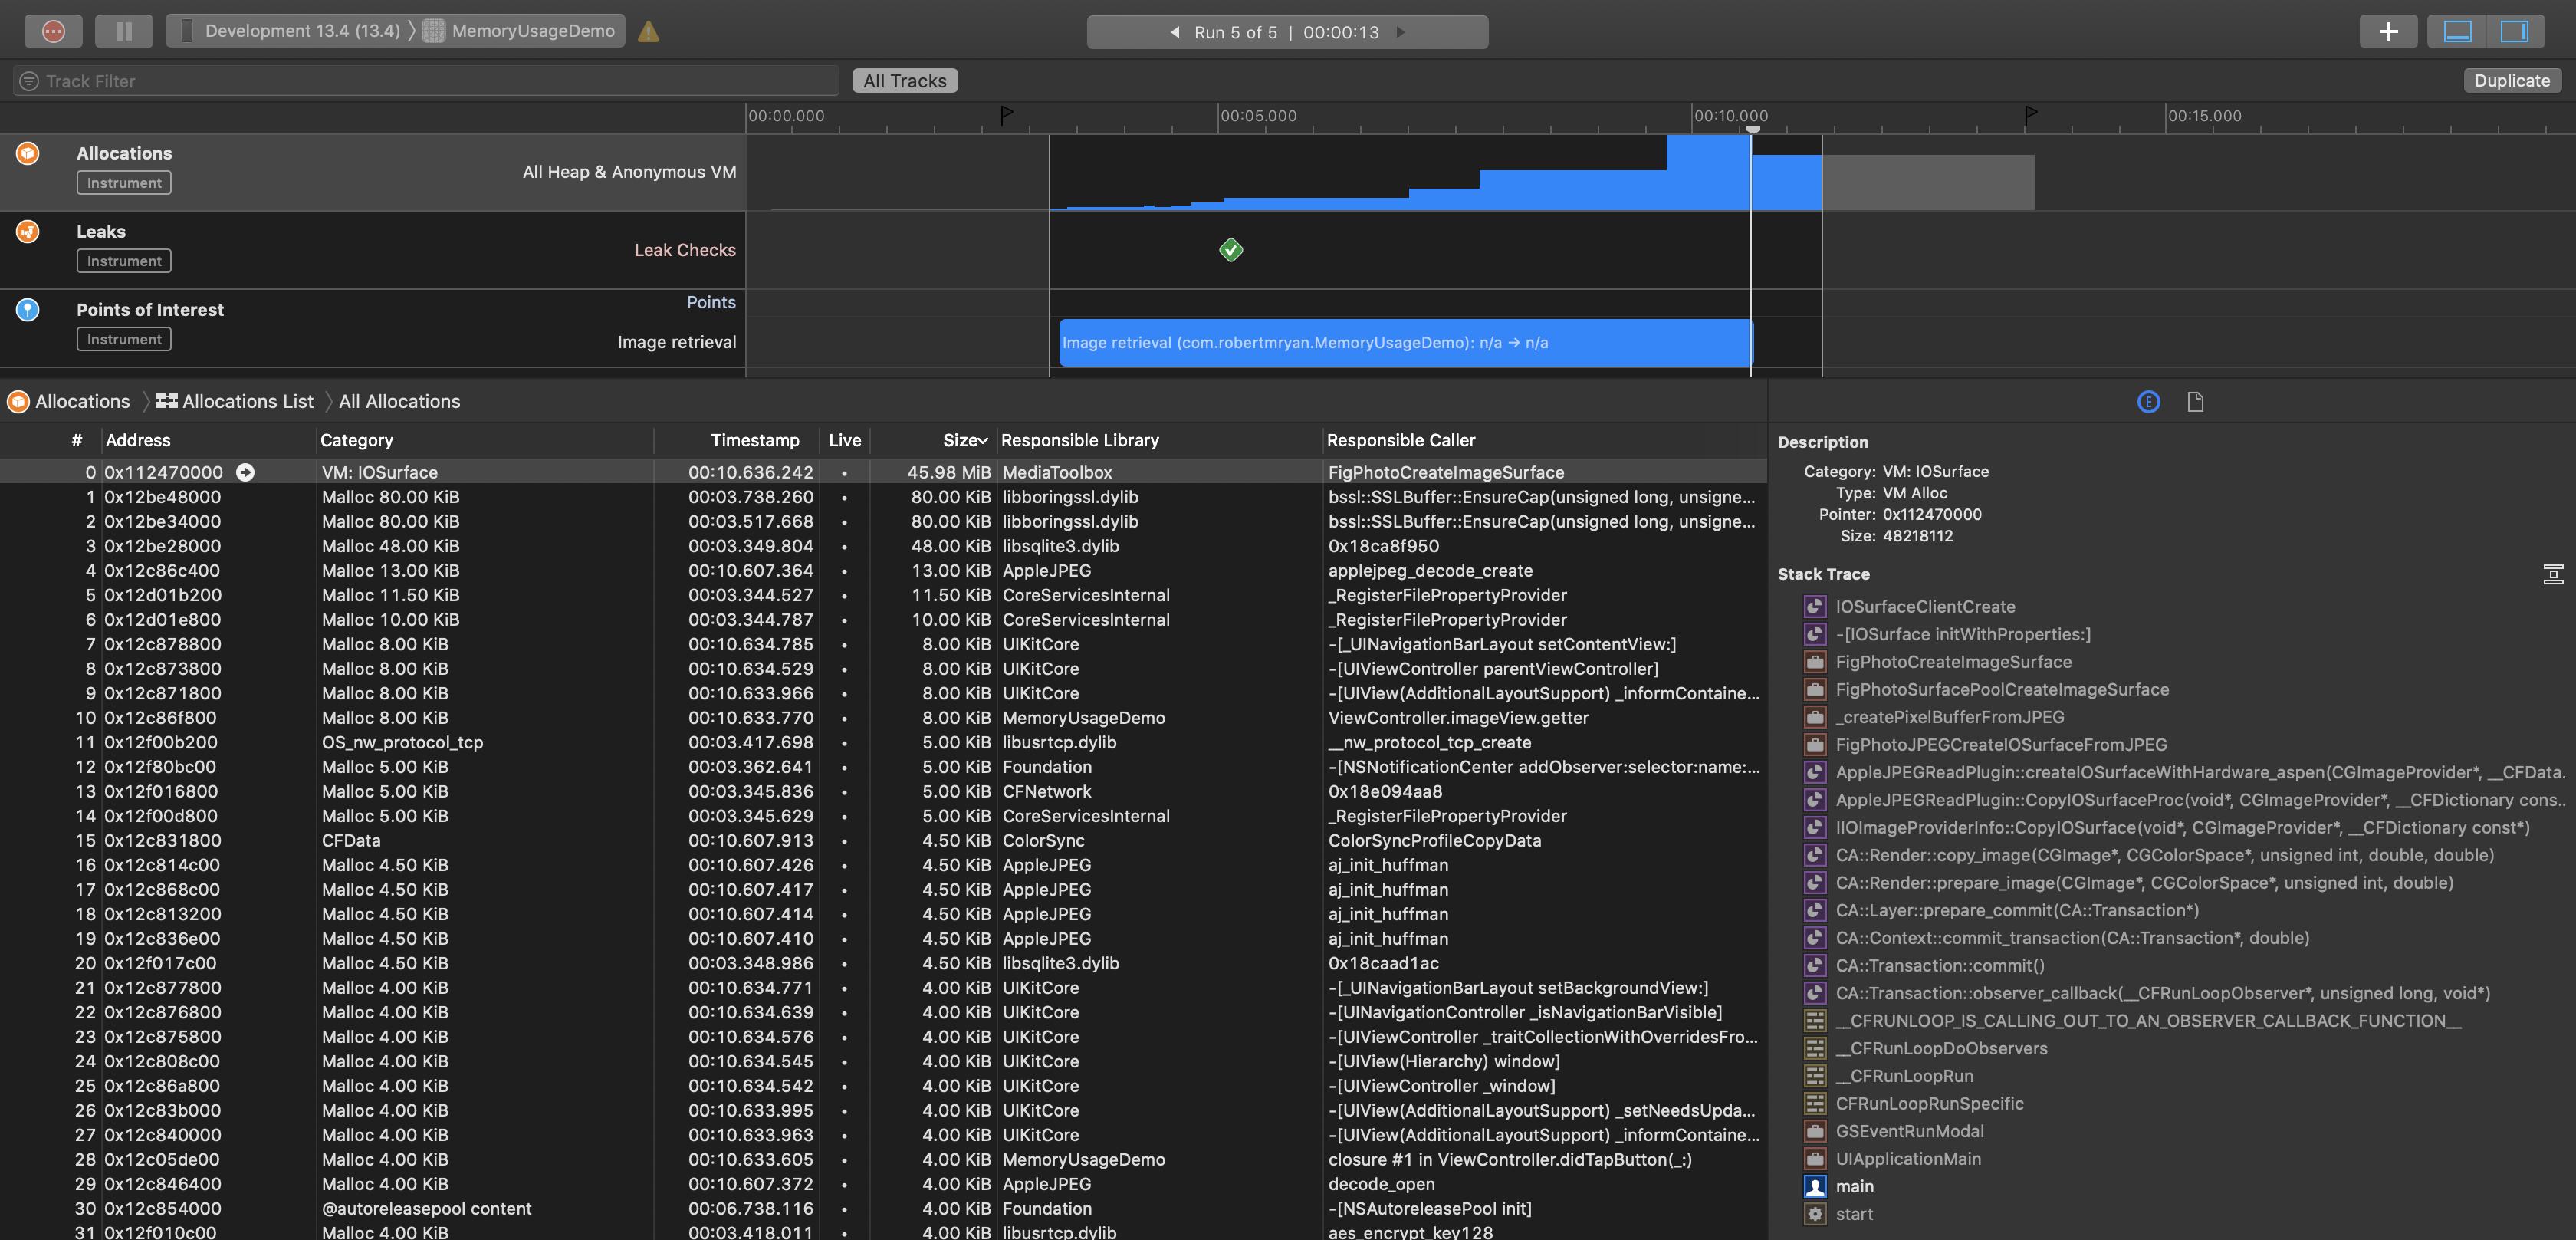
That having been said, using Instruments, you can often get clues about what’s going on. For example, using the “Allocations” tool, go to the list of allocations, and see what was allocated where. If you take that list, sort it by size, and you can see a stack trace, on the right, of where it was allocated:
![enter image description here]()
Now in this case, I used the image in a UIImageView, and therefore the resulting allocation is buried inside the the iOS frameworks, not directly to our code. But one can infer from the stack trace that this was the result of rendering this JPG in the UI.
So, while you can’t easily conclude “oh, that’s the specific Airbus Pleiades image,” you can at least conclude that the particular allocation was associated with some JPG.
A few unrelated observations:
I suspect you were just keeping your example simple, but obviously you would never use Data(contentsOf:) from the main thread like that. Your UI will be blocked and you risk having your app killed by the watchdog process.
You'd generally initiate the network request asynchronously:
 let url = URL(string: "https://effigis.com/wp-content/uploads/2015/02/Airbus_Pleiades_50cm_8bit_RGB_Yogyakarta.jpg")!

 URLSession.shared.dataTask(with: url) { data, _, _ in
     guard
         let data = data,
         let image = UIImage(data: data)
     else {
         return
     }

     DispatchQueue.main.async {
         self.image = image
     }
 }.resume()
This not only avoids blocking the main thread, but you theoretically could use the URLResponse and Error parameters if you wanted any special handling for given errors (e.g. customized error messages in the UI or whatever).
When downloading large assets like this, if you don’t need to show the image in the UI immediately, you might use a download task instead, which has a much lower peak memory usage than Data(contentsOf:) or a dataTask:
 let url = URL(string: "https://effigis.com/wp-content/uploads/2015/02/Airbus_Pleiades_50cm_8bit_RGB_Yogyakarta.jpg")!
 let filename = url.lastPathComponent

 URLSession.shared.downloadTask(with: url) { location, _, _ in
     guard let location = location else { return }

     do {
         let folder = try FileManager.default.url(for: .cachesDirectory, in: .userDomainMask, appropriateFor: nil, create: true)
             .appendingPathComponent("images")
         try FileManager.default.createDirectory(at: folder, withIntermediateDirectories: true)
         let fileURL = folder.appendingPathComponent(filename)
         try FileManager.default.moveItem(at: location, to: fileURL)
     } catch {
         print(error)
     }
 }.resume()
If you do this, you won't require anything close to the 40mb during the download process. That might be critical if downloading lots of assets or if you’re not immediately showing the image in the UI. Also, if you later choose to use background URLSession, you can do this with download tasks, but not data tasks.
It’s worth noting that JPG images (and to a lesser degree, PNG images) are generally compressed. Thus, you can easily find that you might be downloading an asset whose size may be measured in kilobytes, but when you go to use it, will require megabytes. The general rule of thumb is that, regardless of the size of the file you use or the size of the control in which you’re using it, the memory required when you use the image is generally 4 × width × height (measured in pixels).
For example, a 5,494 × 5,839 px image may take up 122 mb (!) when you go to use it. The particulars may vary, but 4 × width × height is a good assumption. When considering memory consumption, the size of the file is a misleading indication of the amount of memory that might be used when you go to use this asset. Always consider the actual image dimensions because it’s going to be uncompressed when you use it.
In my answer above, I focused on Instruments’ Allocations tool. But it's worth noting that when diagnosing memory usage, the “Debug Memory Graph” feature is great when you’re trying to diagnose where the strong references are (great for identifying strong reference cycles). It’s not really relevant to this particular discussion, but can be useful if you’re tracking down where you used an image.
For example, here, I’ve downloaded your image (using URLSession) and not only set the image property of my view controller, but also used it in a UIImageView. This “Debug Memory Graph” tool is great for visualizing what is used where (but admittedly, not for correlating specific memory allocations to code):
![enter image description here]()
I also editing my scheme’s diagnostic options to include the “malloc stack” feature, giving me the stack trace, on the right, like you see in the Allocations tool, above.


