Why is for-in slower than while in swift debugging mode?
Asked Answered
C

1

5

Why is for-in slower than while in swift debugging mode ? If you think, yes It was ran in no optimization.

⬇️Below code, Time is compare of for-in and while in no optimization

49999995000000 for-in -- time = 3.3352

4999999950000000 while -- time = 0.3613

⬇️but, If using optimization for speed

49999995000000 for-in -- time = 0.0037

49999995000000 while -- time = 0.0035

I wonder that "why is for-in slower than while in no optimization? and why are for-in and while so fast in optimization? "

import Foundation

func processTime(_ title: String, blockFunction: () -> ()) {
    print()
    let startTime = CFAbsoluteTimeGetCurrent()
    blockFunction()
    let processTime = CFAbsoluteTimeGetCurrent() - startTime
    print(title, " -- time = \(String(format : "%.4f",processTime))")
}

processTime("for-in") {
    var sum = 0
    for i in 0..<10000000 {
        sum += i
    }
    print(sum)
}

processTime("while") {
    var sum = 0
    var i = 0
    while i<10000000 {
        sum += i
        i += 1
    }
    print(sum)
}

Convector answered 9/4, 2021 at 12:23 Comment(0)
S
8

From a Swift perspective, your for loop actually translates to something like this:

let range = 0..<10000000
var iterator = range.makeIterator()
while let next = iterator.next() {
    ...
}

Notice that's a lot of calls to next on the range's iterator, which has its own state that has to be kept track of, and IndexingIterator.next calls a bunch of protocol methods, dispatching which takes some time too as it has to lookup the witness table. See exactly what calls Iterator.next is going to make here.

If you are in debug mode, none of that is going to be optimised.

Compare that to your while loop, which is basically set something to 0, compare, do the thing in the loop, add 1 to it, repeat. Clearly this is much simpler to do than calling all those methods.

If you enable optimisations however, the compiler can see that the for loop is doing what the while loop does anyway.


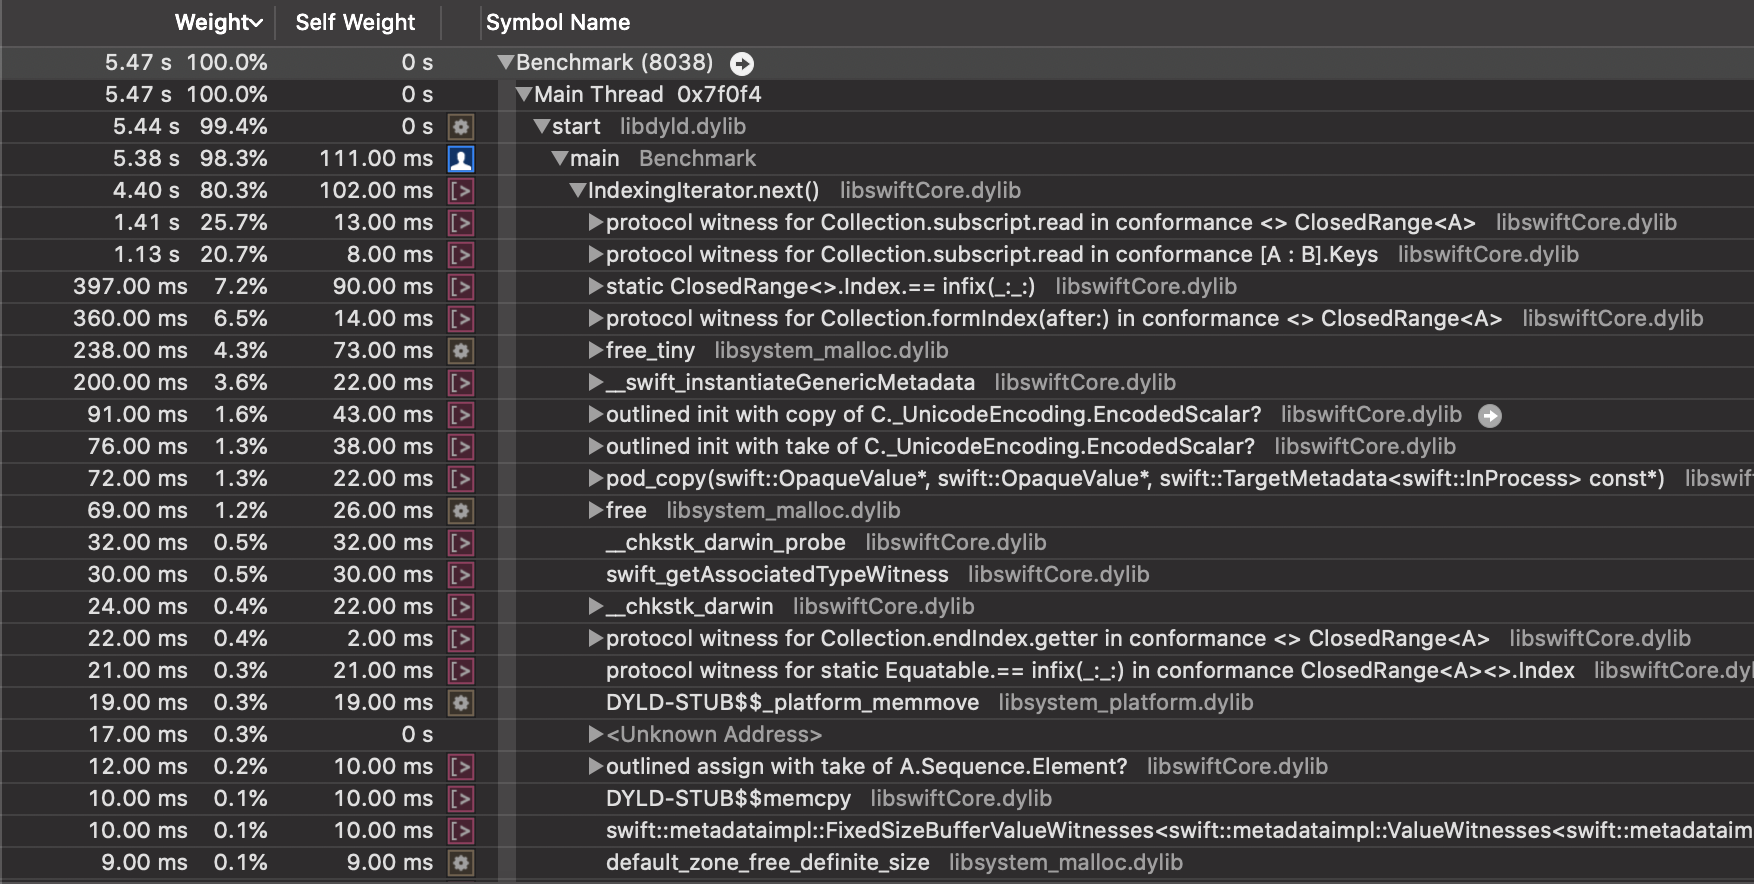
Because I find it interesting, I did a little time profile of a loop such as:

var s = ""
for i in 0...10000000 {
    s += "\(i)"
}

enter image description here

80% of the time is spent on next(), and look at how many things it does! My screenshot can't even contain everything. The string concatenating only takes up about 6% (not in the screenshot).

Spun answered 9/4, 2021 at 13:26 Comment(9)
Thanks to you, I now could learn makeIterator() even very important concept of virtual method you talk. Thank you so much!Convector
@Convector I did a time profile for a simple loop. You can see exactly how much time is spent on dispatching the protocol methods. Look at the rows that say "protocol witness ..."Spun
Oh my god! I didn't know that cool time profiler. I should learn that. Thank you. I really want to see that. It will be very useful for me! Thank you soooo much!Convector
Would be interesting to see the difference when we compile with optimisation. Ideally, there would be none.Domitian
You may also find it useful to run swiftc -emit-sil -O <file.swift>. This dumps out what Swift is "really" doing, at least at the level of the Swift Intermediate Language. Clang will generally optimize these things even further, but learning to read SIL output is a great skill for learning optimization. You may also be interested in exploring the even more massive difference in (0..<10000000).reduce(0, +) in non-optimized vs optimized.Fantasize
@RobNapier Oh, Thank you!! Actually I knew SIL, but thanks to you, people who didn't know that concept could understand "what is SIL?, why is SIL useful in compile time? " even you give some example interesting. Thank you so much! I will have to learn SIL more.Convector
@RobNapier I was using godbolt to compare the assembly code. I saw the optimised version got rid of all the IndexingIterators, but otherwise couldn’t read the asm. I never knew SIL was a thing! Thank you for telling me about that too!Spun
I love godbolt so much. It gives a lot of insight into what's going on. Compare the -O version of the for-loop (godbolt.org/z/drETfhM7j) with the -Ounchecked version (godbolt.org/z/d4T7Yd5nc). The entire loop is precomputed and turned into a single movabs r14, 49999995000000 (i.e. "just store the answer"). But in -O mode, it adds checks after every at every step for an overflow. (You can also fix that by using &+ instead of +.)Fantasize
@Spun Hi, my professor, Could you give me information about my new question? #67033283Convector

© 2022 - 2024 — McMap. All rights reserved.