Plotly: Range slider not being displayed for row count > 500
Asked Answered
T

3

5

enter image description here

As is visible from the image, the scaffolding for the rangeslider is generated but the trace inside it is not. It is also fully functional otherwise. With some experiment, I found that only if you set the no. of rows to 500 or less, it displays correctly. Is there a way to display it for rows more than that? Here is the code to reproduce-

size = 501 #change this to change no. of rows

import numpy as np
import pandas as pd
import plotly.express as px

df = {'date': pd.date_range(start='2021-01-01', periods=size, freq='D'),
     'new_cases': np.random.random(size=size),
     'new_cases_smoothed': np.random.random(size=size)}

df = pd.DataFrame(df)
fig = px.line(df, x='date', y=['new_cases','new_cases_smoothed'])
fig.update_layout(xaxis=dict(rangeslider=dict(visible=True),type="date"))
fig.show()
Turbary answered 24/5, 2021 at 11:37 Comment(0)
H
2

This works in graph_objects

size = 501 #change this to change no. of rows

import numpy as np
import pandas as pd
import plotly.express as px
import plotly.graph_objects as go

df = {'date': pd.date_range(start='2021-01-01', periods=size, freq='D'),
     'new_cases': np.random.random(size=size),
     'new_cases_smoothed': np.random.random(size=size)}

df = pd.DataFrame(df)
# fig = px.line(df, x='date', y=['new_cases','new_cases_smoothed'])
fig = go.Figure(data=[go.Scatter(x=df["date"], y=df[c], name=c) for c in ['new_cases','new_cases_smoothed']])
fig.update_layout(xaxis={"rangeslider":{"visible":True},"type":"date",
                        "range":[df.tail(50)["date"].min(),df.tail(50)["date"].max()]})
fig.show()

Heyer answered 24/5, 2021 at 14:20 Comment(1)
Thanks for this! I'll holdout a bit longer for a plotly express answer. If there's none, I'll mark this as the answerTurbary
B
6

For others using plotly.express, I had luck setting the kwarg render_mode='webg1':

size = 501 #change this to change no. of rows

import numpy as np
import pandas as pd
import plotly.express as px

df = {'date': pd.date_range(start='2021-01-01', periods=size, freq='D'),
     'new_cases': np.random.random(size=size),
     'new_cases_smoothed': np.random.random(size=size)}

df = pd.DataFrame(df)
fig = px.line(df, x='date', y=['new_cases','new_cases_smoothed'], render_mode='webg1')
fig.update_layout(xaxis=dict(rangeslider=dict(visible=True),type="date"))
fig.show()
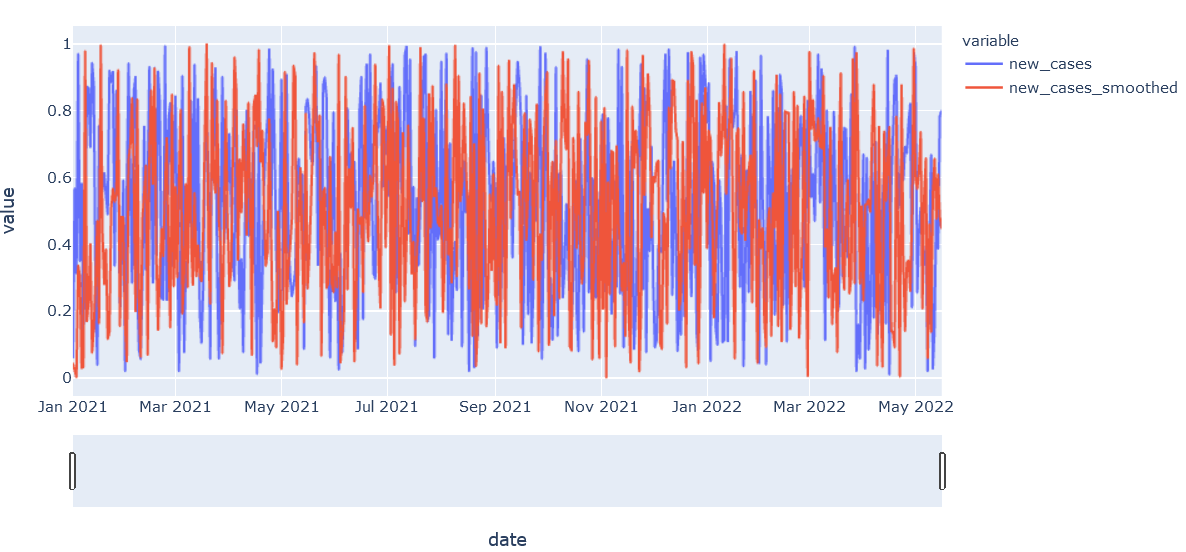
Before answered 9/5, 2022 at 16:39 Comment(1)
As pointed by @matgc, there is a typo here (webg1 instead of webgl). It seems to work with any value in render_mode. Funny enough, but render_mode="dummy" also works.... Note that this also works with the plotly backend directy : fig = df.plot(x="date", y=["new_cases", "new_cases_smoothed"], render_mode="dummy")Thionate
H
2

This works in graph_objects

size = 501 #change this to change no. of rows

import numpy as np
import pandas as pd
import plotly.express as px
import plotly.graph_objects as go

df = {'date': pd.date_range(start='2021-01-01', periods=size, freq='D'),
     'new_cases': np.random.random(size=size),
     'new_cases_smoothed': np.random.random(size=size)}

df = pd.DataFrame(df)
# fig = px.line(df, x='date', y=['new_cases','new_cases_smoothed'])
fig = go.Figure(data=[go.Scatter(x=df["date"], y=df[c], name=c) for c in ['new_cases','new_cases_smoothed']])
fig.update_layout(xaxis={"rangeslider":{"visible":True},"type":"date",
                        "range":[df.tail(50)["date"].min(),df.tail(50)["date"].max()]})
fig.show()

Heyer answered 24/5, 2021 at 14:20 Comment(1)
Thanks for this! I'll holdout a bit longer for a plotly express answer. If there's none, I'll mark this as the answerTurbary
M
0

Interesting, you typed WEBG1 instead of WEBGL and it worked. If you input WEBGL it doesn't work. In fact if you type anything that should not be accepted as valid such as just blank (render_mode='') it works as well.

Go figure...

Mantelet answered 7/2, 2023 at 19:29 Comment(2)
This is not an answer to the question. We you have enough reputation, you can comment on posts. Please read How to Answer.Lax
True enough, but this comment is still usefull. I'll pick it up in the trending answer.Thionate

© 2022 - 2024 — McMap. All rights reserved.