Sampling from the multivariate normal distribution
You can use MultivariateNormal to sample from a multivariate normal.
>>> h, w = 200, 200
>>> fmap = torch.zeros(h, w)
Fill fmap with the origin points:
>>> pts = torch.rand(20, 2)
>>> pts *= torch.tensor([h, w])
>>> x, y = pts.T.long()
>>> x, y = x.clip(0, h), y.clip(0, w)

>>> fmap[x, y] = 1
Following this, we can sample from the following distribution (you can adjust the covariance matrix accordingly):
>>> sampler = MultivariateNormal(pts.T, 10*torch.eye(len(pts)))

>>> for x in range(10):
...    x, y = sampler.sample()
...    x, y = x.clip(0, h).long(), y.clip(0, w).long()
...    fmap[x, y] = 1
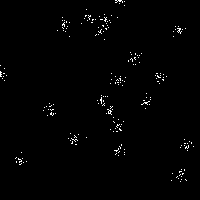
As a result, you can end up with something like:
| Origin points |
Normal sampling |
![!]() |
![!]() |
This is not documented well enough, but you can pass the sample shape to the sample function. This allows you to sample multiple points per call, i.e. you only need one to populate your canvas.
Here is a function to draw from MultivariateNormal:
def multivariate_normal_sampler(mean, cov, k):
    sampler = MultivariateNormal(mean, cov)
    return sampler.sample((k,)).swapaxes(0,1).flatten(1)
Then you can call it as:
>>> x, y = multivariate_normal_sampler(mean=pts.T, cov=50*torch.eye(len(pts)), k=1000)
Clip the samples:
>>> x, y = x.clip(0, h-1).long(), y.clip(0, w-1).long()
Finally insert into fmap and draw:
>>> fmap[x, y] += .1
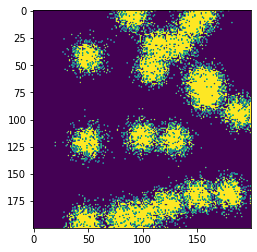
Here is an example preview:
k=1,000 |
k=50,000 |
![!]() |
![!]() |
The utility function is available as torch.distributions.multivariate_normal.MultivariateNormal
Computing the density map using the pdf
Alternatively, instead of sampling from the normal distribution, you could compute the density values based on its probability density function (pdf):
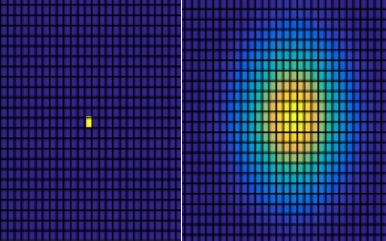
![!]()
A particular example of a two-dimensional Gaussian function is:
![enter image description here]()
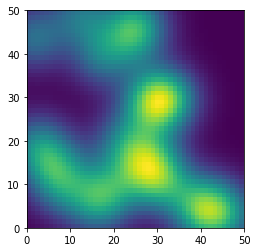
Origin points:
>>> h, w = 50, 50
>>> x0, y0 = torch.rand(2, 20)
>>> origins = torch.stack((x0*h, y0*w)).T
Define the gaussian 2D pdf:
def gaussian_2d(x=0, y=0, mx=0, my=0, sx=1, sy=1):
    return 1 / (2*math.pi*sx*sy) * \
      torch.exp(-((x - mx)**2 / (2*sx**2) + (y - my)**2 / (2*sy**2)))
Construct the grid and accumulate the gaussians from each origin points:
x = torch.linspace(0, h, h)
y = torch.linspace(0, w, w)
x, y = torch.meshgrid(x, y)

z = torch.zeros(h, w)
for x0, y0 in origins:
  z += gaussian_2d(x, y, mx=x0, my=y0, sx=h/10, sy=w/10)
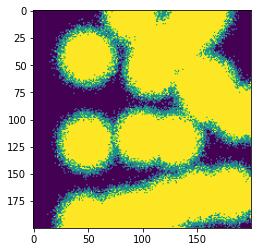
| Multivariate normal distributions |
![!]() |
The code to plot the grid of values is simply using matplotlib.pyplot.pcolormesh: plt.pcolormesh(x, y, z).

