R how to specify custom color gradients with breakpoints
Asked Answered
L

1

5

I'm trying to create a custom gradient scale in R that will change colors based on values.

Basically:

I want the fill color to be a gradient between darkblue and blue for values that are between 1 and 50.

I want the fill color to be a gradient between lightblue and yellow for values that are between 50 and 100.

And so on...

I've tried the code below, but this is clearly the wrong way to do it:

scale_fill_gradientn(limits = c(0,50),colours=c("darkblue","blue"),na.value="#101010") +
scale_fill_gradientn(limits = c(50,100),colours=c("lightblue","yellow"),na.value="#101010") +
scale_fill_gradientn(limits = c(100,1000),colours=c("orange","orangered"),na.value="#101010") +
scale_fill_gradientn(limits = c(1000,10000),colours=c("darkred","red"),na.value="#101010") + 
scale_fill_gradientn(limits = c(10000,30000),colours=c("red","#FF877D"),na.value="#101010") + 

Could someone help me out?

Edit:

Using this code:

scale_fill_gradientn(
  limits  = range(0,max(da$val)),
  colours = colours[c(1, seq_along(colours), length(colours))],
  values  = c(0, scales::rescale(colour_breaks, from = range(0,da$val)),range(0,da$val))) + 

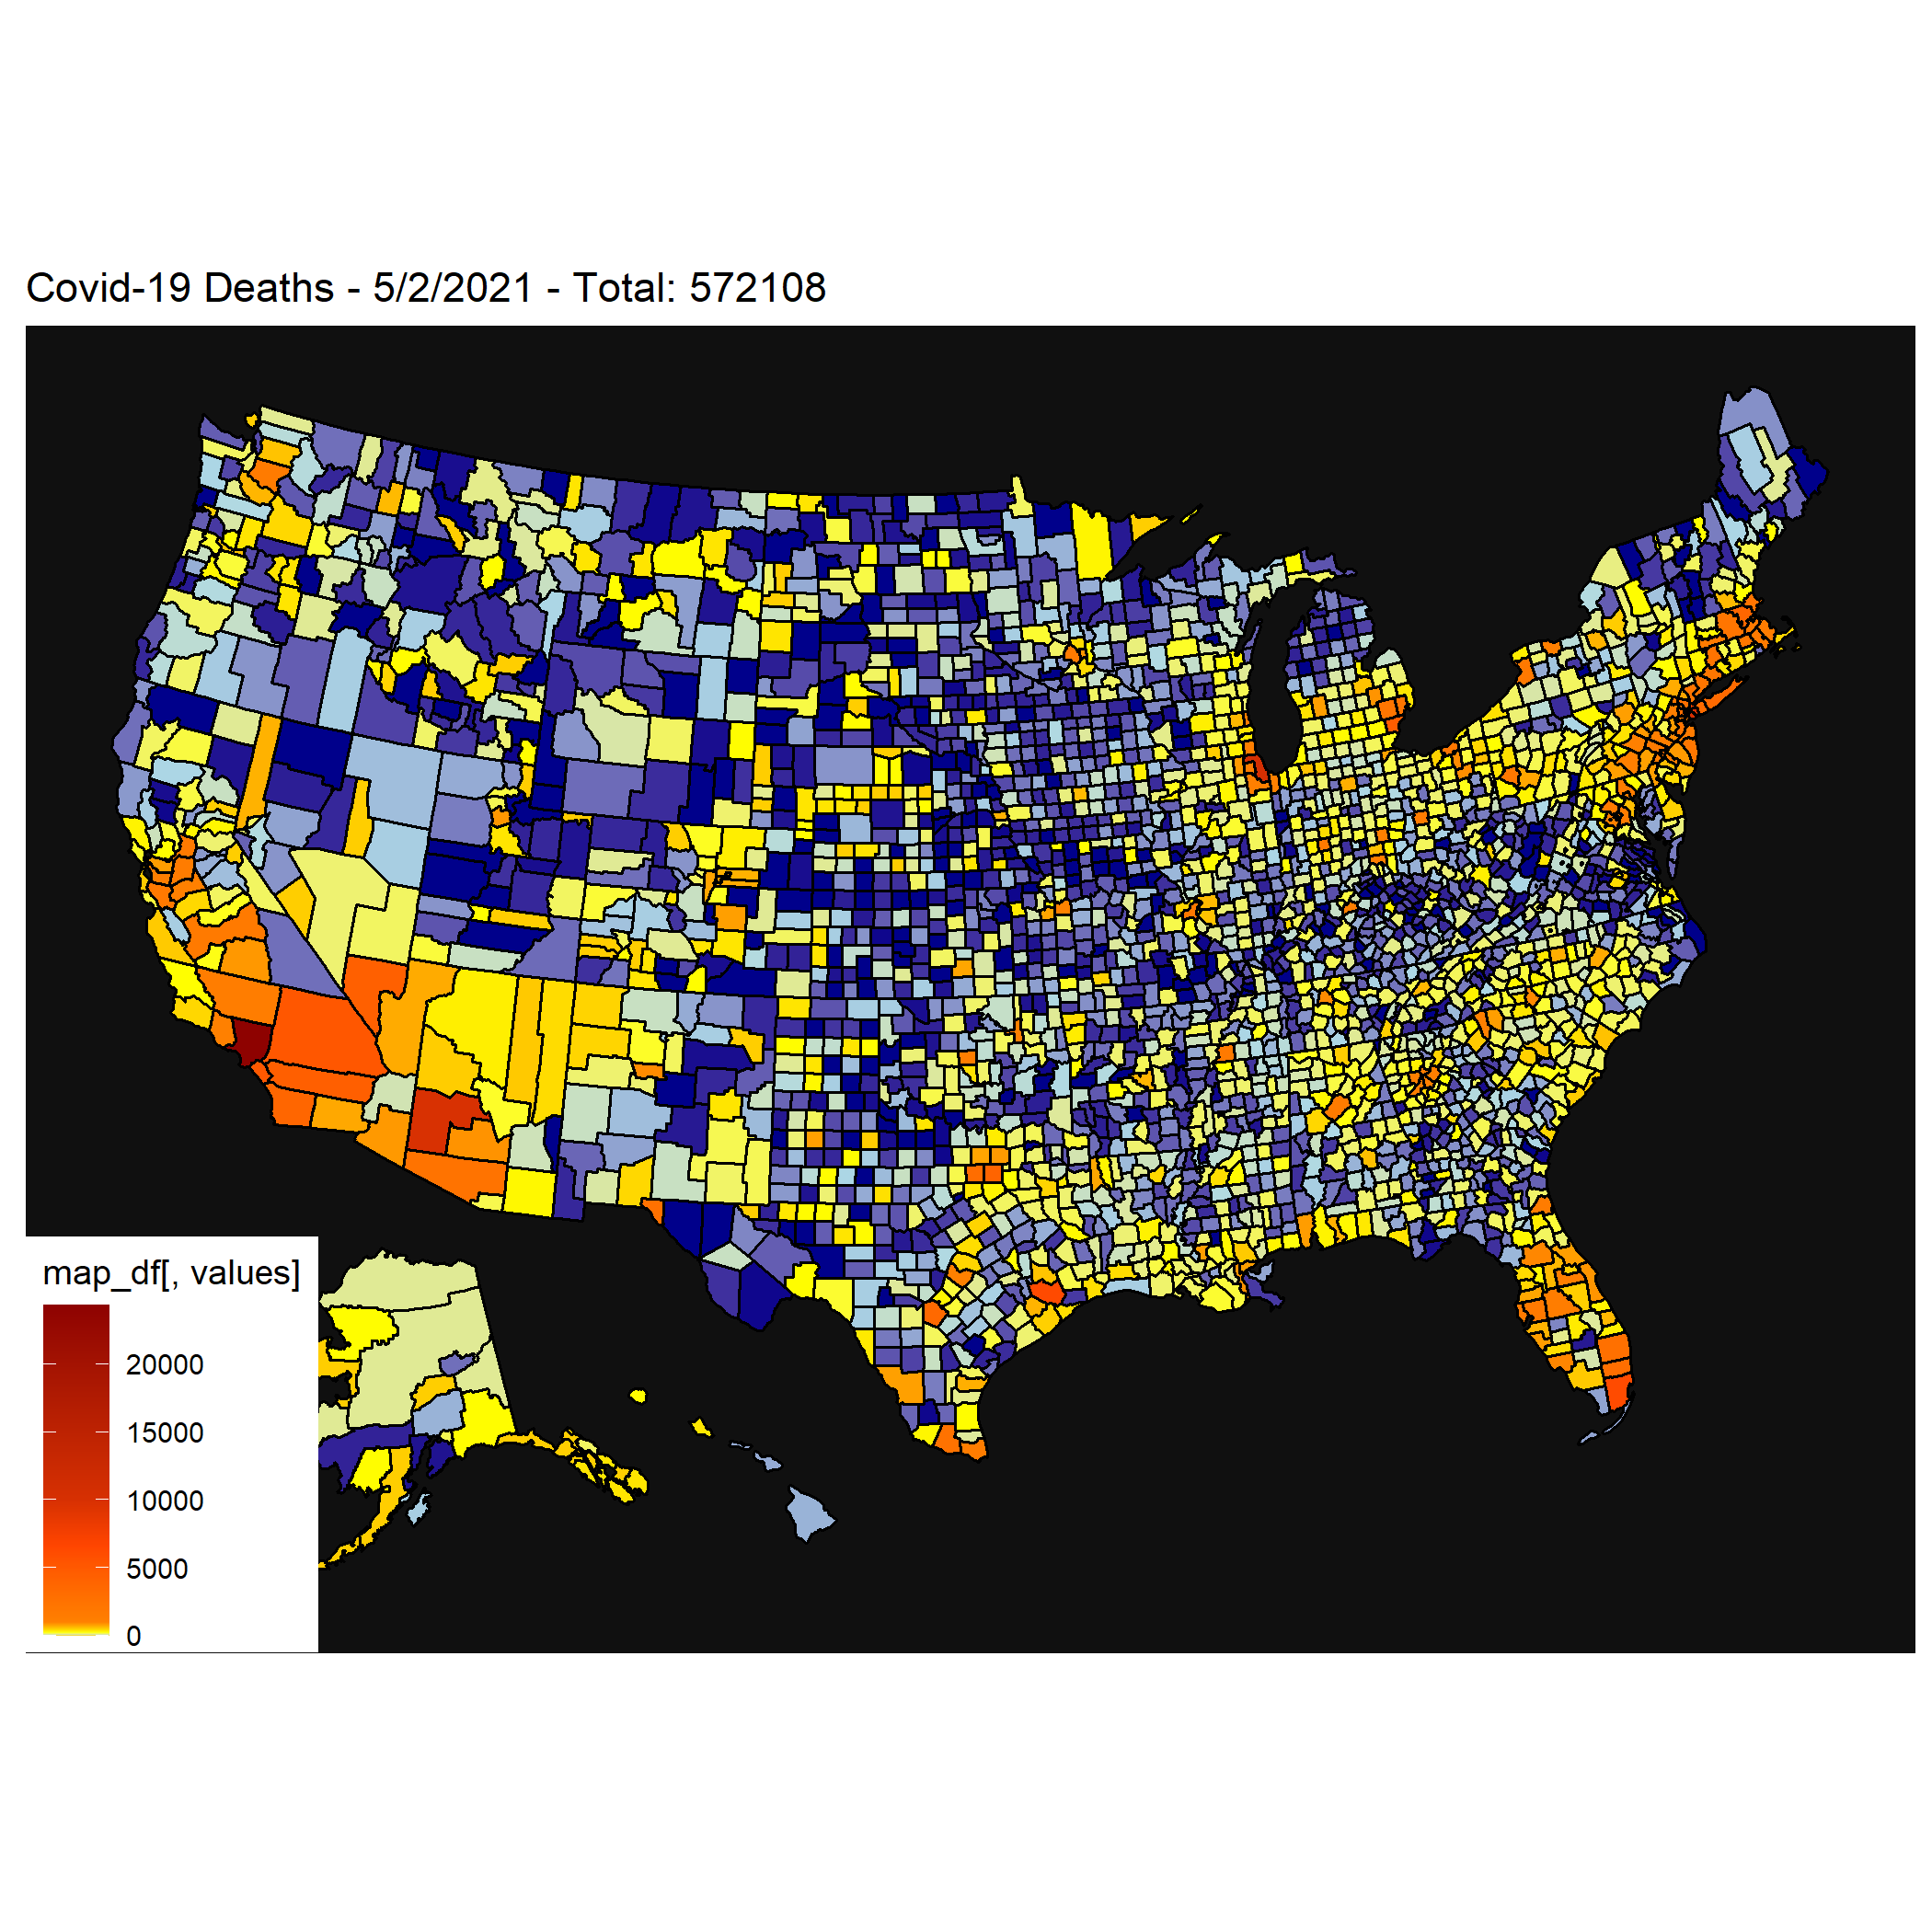
I get this effect:

Example

Which is close to what I'm going for, but I don't really understand the rescale code and what it's doing.

I want it to start as blue and go up to red using the breaks.

It's close - just starting at yellow.

Edit:

With help from @teunbrand, I got it it working!

Here's the code:

my_limits <- range(c(0, usa.dat[,50:ncol(usa.dat)]))
max_value <- max(usa.dat[, 50:ncol(usa.dat)])

for (i in 2:ncol(usa.dat)) {
  da <- data.frame(fips=usa.dat$countyFIPS,val=usa.dat[,i])
  tot <- sum(da$val)
  colour_breaks <- c(0,1,100,500,1000,10000,30000)
  colours <- c("#101010","blue","lightblue","yellow","red","darkred","magenta")
  
  current_max <- max(da$val)
  relative_max <- max_value / current_max
  
  theDate <- substr(names(usa.dat)[i],2,100)
  plot_usmap(regions = "counties",
             data=da,
             values="val"
  ) + 
  labs(title=paste("Covid-19 Deaths - ",str_replace_all(theDate,"\\.","/")," - Total: ",tot,sep='')) +
  scale_fill_gradientn(limits  = range(0, current_max),
                       colours = colours,
                       values = scales::rescale(colour_breaks, to = c(0, relative_max), from = c(0, max_value)),
                       name="Deaths",na.value="#101010") + 
  theme(panel.background = element_rect(color = "#101010", fill = "#101010"))
  ggsave(paste(sprintf("%03d",i),".png",sep=''))

Results: https://www.youtube.com/watch?v=HZcnhUr6ghw

Edit: Magma Palette: https://www.youtube.com/watch?v=QrgYIl_xqUU

Edit 2: 3D version: https://youtu.be/Lk7E8o6VIQY

Liv answered 13/10, 2021 at 14:40 Comment(0)
A
8

You can set the exact points where a particular colour should be by using the values argument of the scale. In the example below, we want "darkblue" at 10, "lightblue" at 20 and "yellow" at 30.

The only catch is that the values argument works for rescaled values between 0 and 1, so we ought to fix the limits and apply the same rescaling to our breaks.

Lastly, because now values outside the 10-30 range are undefined, it might be best to repeat the colours at the extremes at the (rescaled) values 0 and 1.

library(ggplot2)

colour_breaks <- c(10, 20, 30)
colours <- c("darkblue", "lightblue", "yellow")

ggplot(mpg, aes(displ, hwy, colour = cty)) +
  geom_point() +
  scale_colour_gradientn(
    limits  = range(mpg$cty),
    colours = colours[c(1, seq_along(colours), length(colours))],
    values  = c(0, scales::rescale(colour_breaks, from = range(mpg$cty)), 1),
  )

Created on 2021-10-13 by the reprex package (v2.0.1)

As a small note: in your description it is unclear what the colour should be at 50: in one gradient it should be blue and in the other it should be lightblue. At best, you can set one of the colours (let's say blue) to 50 and use a 50 + a miniscule offset (e.g. .Machine$double.eps) for the lightblue break.

Attend answered 13/10, 2021 at 14:49 Comment(13)
Thanks so much for your reply. I'm trying to figure out how to pass the values from my dataset into the color scale thing.Liv
My issue is that I'm using a bunch of plots to create an animation and I don't want the gradient scale to arbitrarily shift up. I want the colors to remain the same no matter how high the scale goes.Liv
Fixing the limits (instead of having ggplot2 determine them dynamically) should be appropriate for that too.Attend
I'm not quite sure how to fix the limits. Do I use breaks as well?Liv
If I just set the limit at max then you can barely see the color changes from the gradient it seems.Liv
My goal is to make the colors pop even for low values in those areas despite the range going up to 30,000Liv
You can set them manually as well, and then use the manual limits in both the limits argument and in the rescale(..., from = limits) bit.Attend
I almost need the gradient scale to introduce more and more colors as the limits go up, but not introduce the entire scale from the beginning.Liv
This doesn't seem to work: scale_fill_gradientn(limits = range(0,max(da$val)), colours = colours[c(1, seq_along(colours), length(colours))], values = c(0, scales::rescale(colour_breaks, from = range(0,da$val)), 1))Liv
I get some interesting effects by changing the rescale 1 to something else - almost looks like kind of what i'm going for, except the colors are all backwardsLiv
I've lost the thread on what you exactly are trying to achieve. If you provide a self contained minimal example of the problem you're encountering, people could try to investigate where the problem occurs.Attend
See my edit - I have added the code exampleLiv
Let us continue this discussion in chat.Liv

© 2022 - 2024 — McMap. All rights reserved.