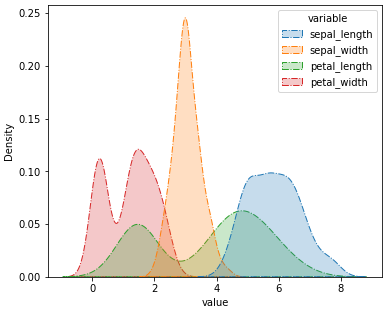
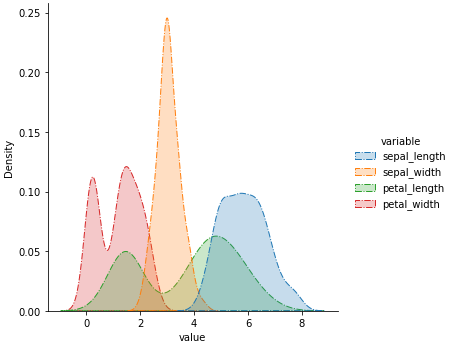
- With
fill=True the object to update is in .collections
- With
fill=False the object to update is in .lines
- Updating the legend is fairly simple:
handles = p.legend_.legendHandles[::-1] extracts and reverses the legend handles. They're reversed to update because they're in the opposite order in which the plot linestyle is updated- Note that figure-level plots extract the legend with
._legend, with the axes-level plots use .legend_.
- Tested in
python 3.8.12, matplotlib 3.4.3, seaborn 0.11.2
kdeplot: axes-level
- Extract and iterate through
.collections or .lines from the axes object and use .set_linestyle
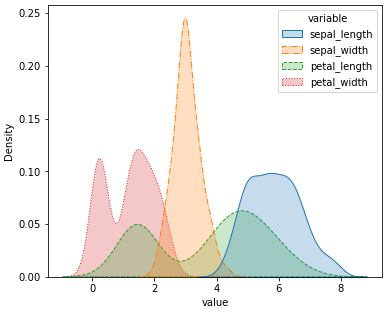
fill=True
fig = plt.figure(figsize=(6, 5))
p = sns.kdeplot(data=im, x='value', hue='variable', fill=True)

lss = [':', '--', '-.', '-']

handles = p.legend_.legendHandles[::-1]

for line, ls, handle in zip(p.collections, lss, handles):
    line.set_linestyle(ls)
    handle.set_ls(ls)
![enter image description here]()
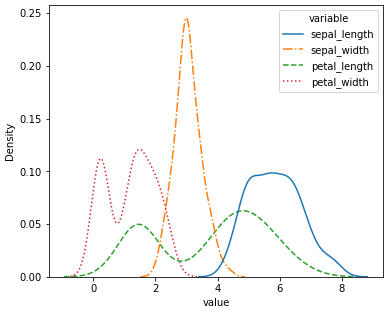
fill=False
fig = plt.figure(figsize=(6, 5))
p = sns.kdeplot(data=im, x='value', hue='variable')

lss = [':', '--', '-.', '-']

handles = p.legend_.legendHandles[::-1]

for line, ls, handle in zip(p.lines, lss, handles):
    line.set_linestyle(ls)
    handle.set_ls(ls)
![enter image description here]()
displot: figure-level
- Similar to the axes-level plot, but each axes must be iterated through
- The legend
handles could be updated in for line, ls, handle in zip(ax.collections, lss, handles), but that applies the update for each subplot. Therefore, a separate loop is created to update the legend handles only once.
fill=True
g = sns.displot(kind='kde', data=im, col='variable', x='value', hue='species', fill=True, common_norm=False, facet_kws={'sharey': False})

axes = g.axes.flat

lss = [':', '--', '-.']

for ax in axes:
    for line, ls in zip(ax.collections, lss):
        line.set_linestyle(ls)

handles = g._legend.legendHandles[::-1]
for handle, ls in zip(handles, lss):
    handle.set_ls(ls)
![enter image description here]()
fill=False
g = sns.displot(kind='kde', data=im, col='variable', x='value', hue='species', common_norm=False, facet_kws={'sharey': False})

axes = g.axes.flat

lss = [':', '--', '-.']

for ax in axes:
    for line, ls in zip(ax.lines, lss):
        line.set_linestyle(ls)

handles = g._legend.legendHandles[::-1]
for handle, ls in zip(handles, lss):
    handle.set_ls(ls)
![enter image description here]()


