- Iterate through each subplot / FacetGrid with
for ax in g.axes.flat:.
ax.patches contains matplotlib.patches.Rectangle and matplotlib.patches.PathPatch, so the correct ones must be used.
- Caveat: all hues must appear for each group in each Facet, otherwise the
patches and hatches will not match.
- In this case, manual or conditional code will probably be required to correctly determine
h, so zip(patches, h) works.
- Tested in
python 3.10, pandas 1.4.2, matplotlib 3.5.1, seaborn 0.11.2
import matplotlib as mpl
import seaborn as sns

# load test data
exercise = sns.load_dataset("exercise")

# plot
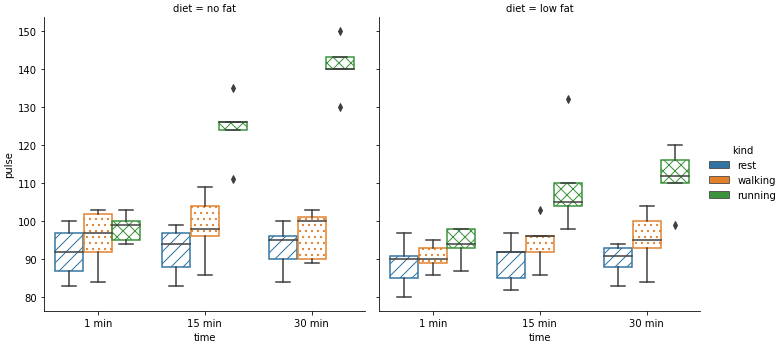
g = sns.catplot(x="time", y="pulse", hue="kind", data=exercise, col='diet', kind="box")

# hatches must equal the number of hues (3 in this case)
hatches = ['//', '..', 'xx']

# iterate through each subplot / Facet
for ax in g.axes.flat:

    # select the correct patches
    patches = [patch for patch in ax.patches if type(patch) == mpl.patches.PathPatch]
    # the number of patches should be evenly divisible by the number of hatches
    h = hatches * (len(patches) // len(hatches))
    # iterate through the patches for each subplot
    for patch, hatch in zip(patches, h):
        patch.set_hatch(hatch)
        fc = patch.get_facecolor()
        patch.set_edgecolor(fc)
        patch.set_facecolor('none')
![enter image description here]()
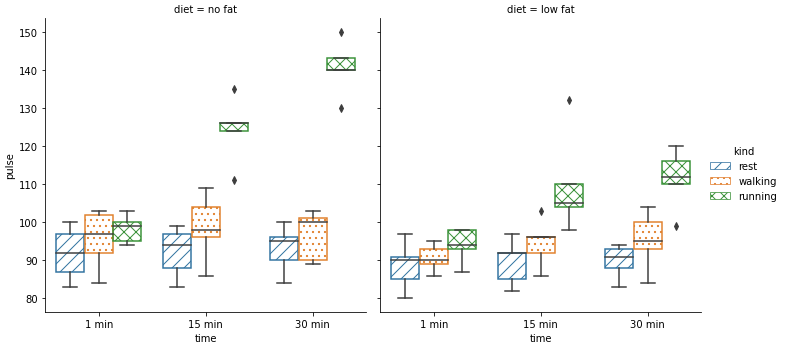
- Add the following, to change the legend.
for lp, hatch in zip(g.legend.get_patches(), hatches):
    lp.set_hatch(hatch)
    fc = lp.get_facecolor()
    lp.set_edgecolor(fc)
    lp.set_facecolor('none')
![enter image description here]()
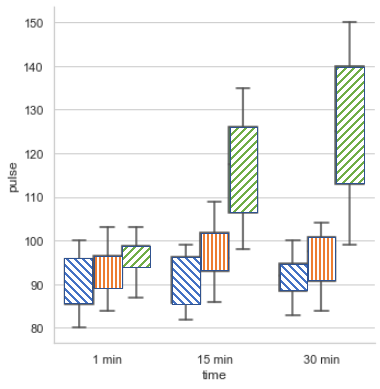
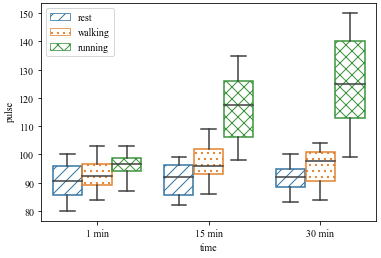
- If only using the axes-level
sns.boxplot, there's no need to iterate through multiple axes.
ax = sns.boxplot(x="time", y="pulse", hue="kind", data=exercise)

# select the correct patches
patches = [patch for patch in ax.patches if type(patch) == mpl.patches.PathPatch]
# the number of patches should be evenly divisible by the number of hatches
h = hatches * (len(patches) // len(hatches))
# iterate through the patches for each subplot
for patch, hatch in zip(patches, h):
    patch.set_hatch(hatch)
    fc = patch.get_facecolor()
    patch.set_edgecolor(fc)
    patch.set_facecolor('none')

l = ax.legend()

for lp, hatch in zip(l.get_patches(), hatches):
    lp.set_hatch(hatch)
    fc = lp.get_facecolor()
    lp.set_edgecolor(fc)
    lp.set_facecolor('none')
![enter image description here]()
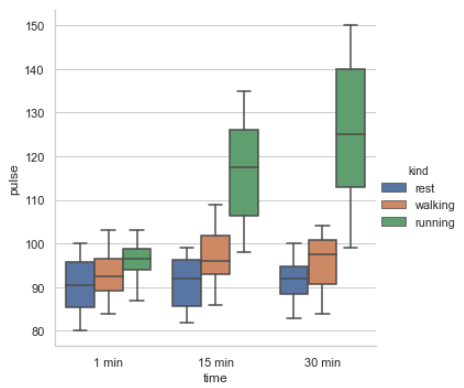
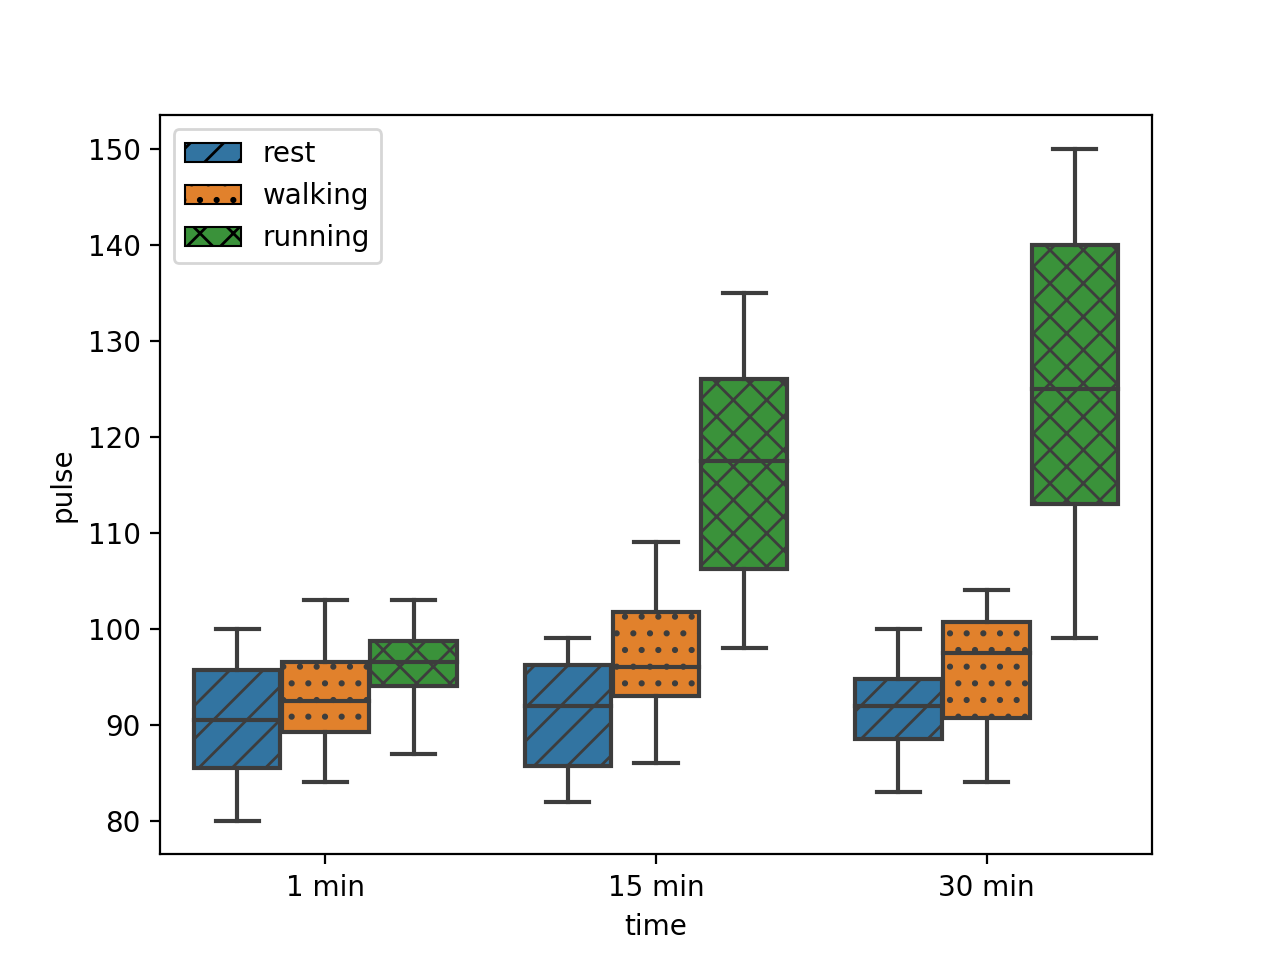
- To keep the facecolor of the box plots:
- Remove
patch.set_facecolor('none')
- Set the edgecolor as
'k' (black) instead of fc, patch.set_edgecolor('k').
- Applies to the
sns.catplot code too.
ax = sns.boxplot(x="time", y="pulse", hue="kind", data=exercise)

# select the correct patches
patches = [patch for patch in ax.patches if type(patch) == mpl.patches.PathPatch]
# the number of patches should be evenly divisible by the number of hatches
h = hatches * (len(patches) // len(hatches))
# iterate through the patches for each subplot
for patch, hatch in zip(patches, h):
    patch.set_hatch(hatch)
    patch.set_edgecolor('k')

l = ax.legend()

for lp, hatch in zip(l.get_patches(), hatches):
    lp.set_hatch(hatch)
    lp.set_edgecolor('k')
![enter image description here]()
