Explanation of Spring Boot Micrometer Metric system_load_average_1m
Asked Answered
G

1

5

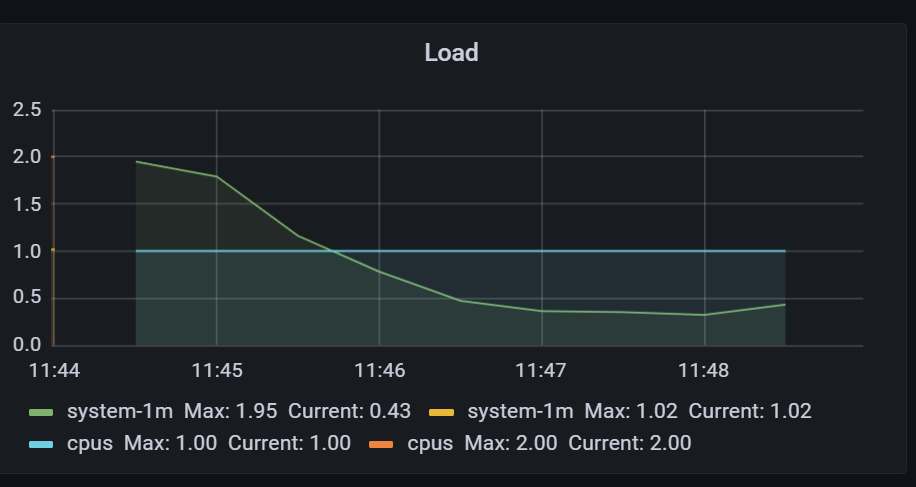
What is the explanation of this metric: system_load_average_1m

This is the help text, but I don't really understand it.

HELP system_load_average_1m The sum of the number of runnable entities queued to available processors and the number of runnable entities running on the available processors averaged over a period of time

In this case I have one CPU.

Does it mean that there are too many task to be solved at the same time, task are queued and waiting to be solved? So the system could stuck for this period of time?

enter image description here

Grigson answered 25/11, 2022 at 10:54 Comment(0)
M
8

The Micrometer metric is merely exposing the underlying OS load number. So you a can learn more about the load average elsewhere. For example: https://www.howtogeek.com/194642/understanding-the-load-average-on-linux-and-other-unix-like-systems/ states:

Unix systems traditionally just counted processes waiting for the CPU, but Linux also counts processes waiting for other resources — for example, processes waiting to read from or write to the disk.

On its own, the load number doesn’t mean too much. A computer might have a load of 0 one split-second, and a load of 5 the next split-second as several processes use the CPU. Even if you could see the load at any given time, that number would be basically meaningless.

That’s why Unix-like systems don’t display the current load. They display the load average — an average of the computer’s load over several periods of time. This allows you to see how much work your computer has been performing.

So it is averaging the load over the last minute and displaying that.

Marrufo answered 28/11, 2022 at 18:22 Comment(0)

© 2022 - 2024 — McMap. All rights reserved.