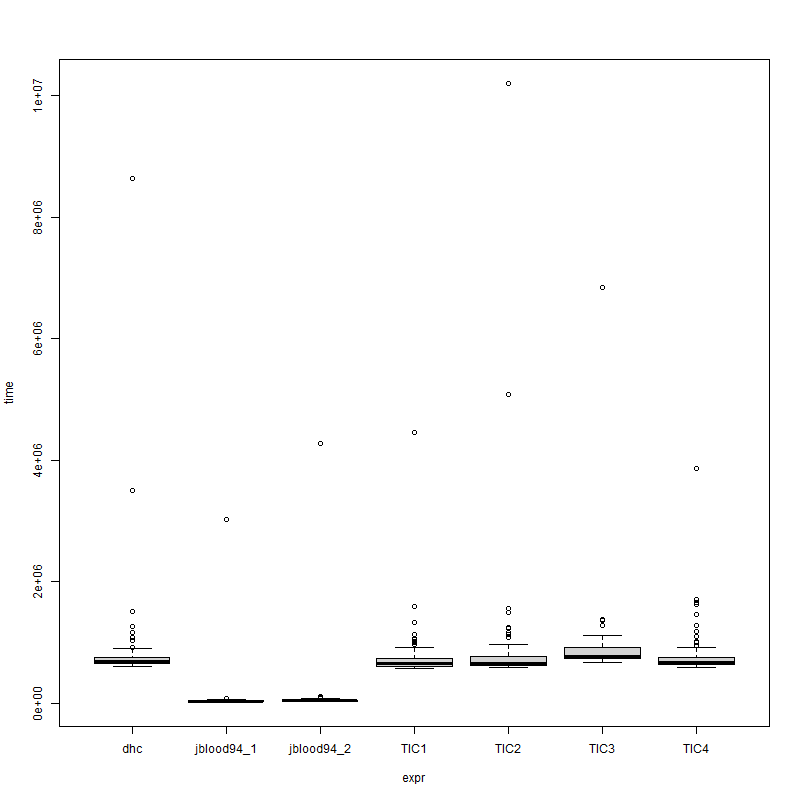
I think you should reduce the number of %*% operators used in your calculation pipe, which should be the most straightforward and effective way to save time.
Code Optimization
For example, you can move your terms in the expression like below
exp(X %*% log(pr.t / (1 - pr.t)) + t(colSums(log(1 - pr.t)))[rep.int(1, nrow(X)), ]) %*% wts
where only the %*% operator is used only twice (instead of 3 as in your original scheme)
Benchmark
We compare your solution, @jblood94's solution, and my solution and see how the performance looks like
# pre-processing since they keep fixed during iterations
n <- ncol(X)
X0 <- unique(X)
mX0 <- 1 - X0
i <- match(X %*% 2^((n - 1):0), X0 %*% 2^((n - 1):0))

f_dhc <- function(X, pr.t, wts) {
    mX <- 1 - X
    exp(X %*% log(pr.t) + mX %*% log(1 - pr.t)) %*% wts
}

f_jblood94_1 <- function(X, pr.t, wts) {
    (exp(X0 %*% log(pr.t) + mX0 %*% log1p(-pr.t)) %*% wts)[i, , drop = FALSE]
}

f_jblood94_2 <- function(X, pr.t, wts) {
    (exp(X0 %*% log(pr.t / (1 - pr.t)) + t(colSums(log1p(-pr.t)))[rep.int(1, nrow(X0)), ]) %*% wts)[i, , drop = FALSE]
}

f_TIC1 <- function(X, pr.t, wts) {
    exp(X %*% log(pr.t / (1 - pr.t)) + t(colSums(log(1 - pr.t)))[rep.int(1, nrow(X)), ]) %*% wts
}

f_TIC2 <- function(X, pr.t, wts) {
    exp(X %*% log(pr.t / (1 - pr.t)) + outer(rep.int(1, nrow(X)), colSums(log(1 - pr.t)))) %*% wts
}

f_TIC3 <- function(X, pr.t, wts) {
    exp(X %*% log(pr.t / (1 - pr.t)) + kronecker(matrix(rep.int(1, nrow(X))), t(colSums(log(1 - pr.t))))) %*% wts
}

f_TIC4 <- function(X, pr.t, wts) {
    exp(X %*% qlogis(pr.t) + t(colSums(log1p(-pr.t)))[rep.int(1, nrow(X)), ]) %*% wts
}

mbm <- microbenchmark(
    dhc = f_dhc(X, pr.t, wts),
    jblood94_1 = f_jblood94_1(X, pr.t, wts),
    jblood94_2 = f_jblood94_2(X, pr.t, wts),
    TIC1 = f_TIC1(X, pr.t, wts),
    TIC2 = f_TIC2(X, pr.t, wts),
    TIC3 = f_TIC3(X, pr.t, wts),
    TIC4 = f_TIC4(X, pr.t, wts),
    check = "equal",
    unit = "relative"
)
set.seed(0)
p <- 1000
q <- 5
r <- 15
X <- matrix(sample(c(0, 1), p * q, replace = TRUE), p, q)
pr.t <- matrix(runif(r * q), q, r)
wts <- runif(r)
and we will see
> mbm
Unit: relative
       expr       min        lq     mean    median        uq       max neval
        dhc 22.869560 22.049715 19.49625 19.354935 17.437032 20.113939   100
 jblood94_1  1.000000  1.000000  1.00000  1.000000  1.000000  1.000000   100
 jblood94_2  1.255509  1.448805  1.59287  1.521874  1.652512  1.655629   100
       TIC1 22.380653 20.909609 10.14739 18.157829 17.205723  1.243090   100
       TIC2 22.621384 21.141098 11.76505 18.266085 17.322903  3.590901   100
       TIC3 26.265694 25.490583 12.36498 22.410242 19.683481  1.743739   100
       TIC4 22.921410 21.263929 10.45764 19.084340 17.894608  1.141133   100
and plot(mbm) shows
![enter image description here]()
set.seed(0)
p <- 1000
q <- 1000
r <- 100
X <- matrix(sample(c(0, 1), p * q, replace = TRUE), p, q)
pr.t <- matrix(runif(r * q), q, r)
wts <- runif(r)
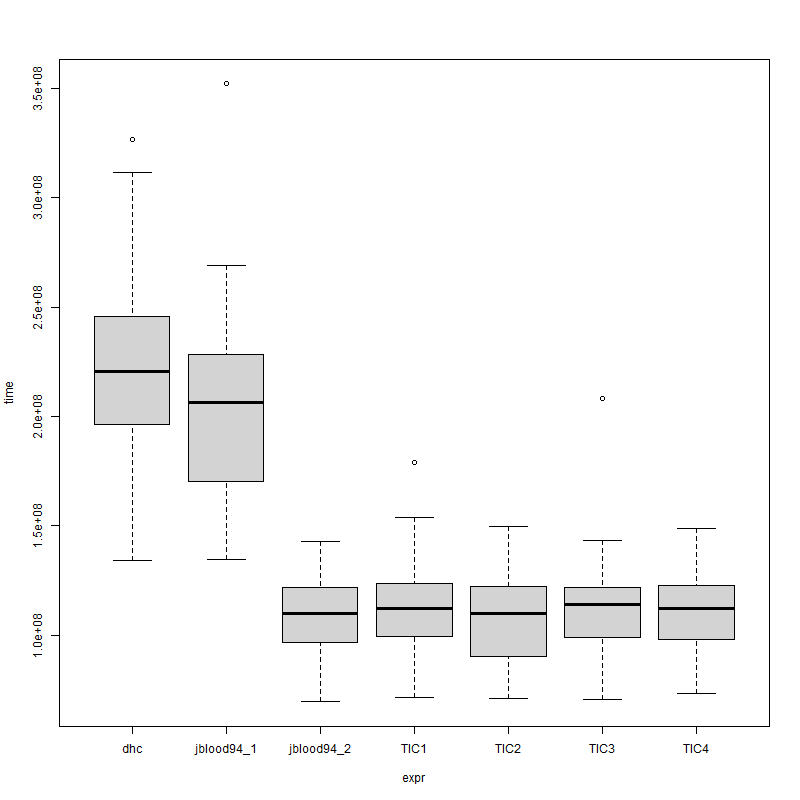
and we will see
> mbm
Unit: relative
       expr       min       lq     mean   median        uq       max neval
        dhc 1.8862821 2.172686 2.030361 2.005938 2.0100325 2.1832300   100
 jblood94_1 1.8933325 1.884341 1.881695 1.875507 1.8684887 2.3552021   100
 jblood94_2 0.9776827 1.071931 1.016522 1.000148 0.9974477 0.9546140   100
       TIC1 1.0086822 1.099217 1.035331 1.018304 1.0093273 1.1968782   100
       TIC2 1.0000000 1.000000 1.000000 1.000000 1.0000000 1.0000000   100
       TIC3 0.9939343 1.095266 1.038841 1.037027 0.9967151 1.3936333   100
       TIC4 1.0297307 1.084197 1.024587 1.018200 1.0050159 0.9950423   100
and plot(mbm) shows
![enter image description here]()


XandmXalways binary matrices? – DalesmanMatrix: it doesn't seem to help in this case, even when I increase sparsity to 99%. As @Dalesman hints, an indexing-based solution might help? – Rampage