Using systrace in application code android
Asked Answered
M

3

5

The documentation in android says

you can use the methods of the Trace class to add instrumentation to 
your application code and see the results in a Systrace report.

I have added the below methods to my code

Trace.beginSection("test-trace");  

// block of code

Trace.endSection();

Now where can I check the results of this section. I start the systrace tool from the android device monitor and recorded it for 30 secs(performed the button click that executes the above the block). It generates the trace.html file but how do i get the above section information from this html file

Mayonnaise answered 10/5, 2015 at 8:38 Comment(0)
T
6

It is there, I myself searched for it about one hour :D

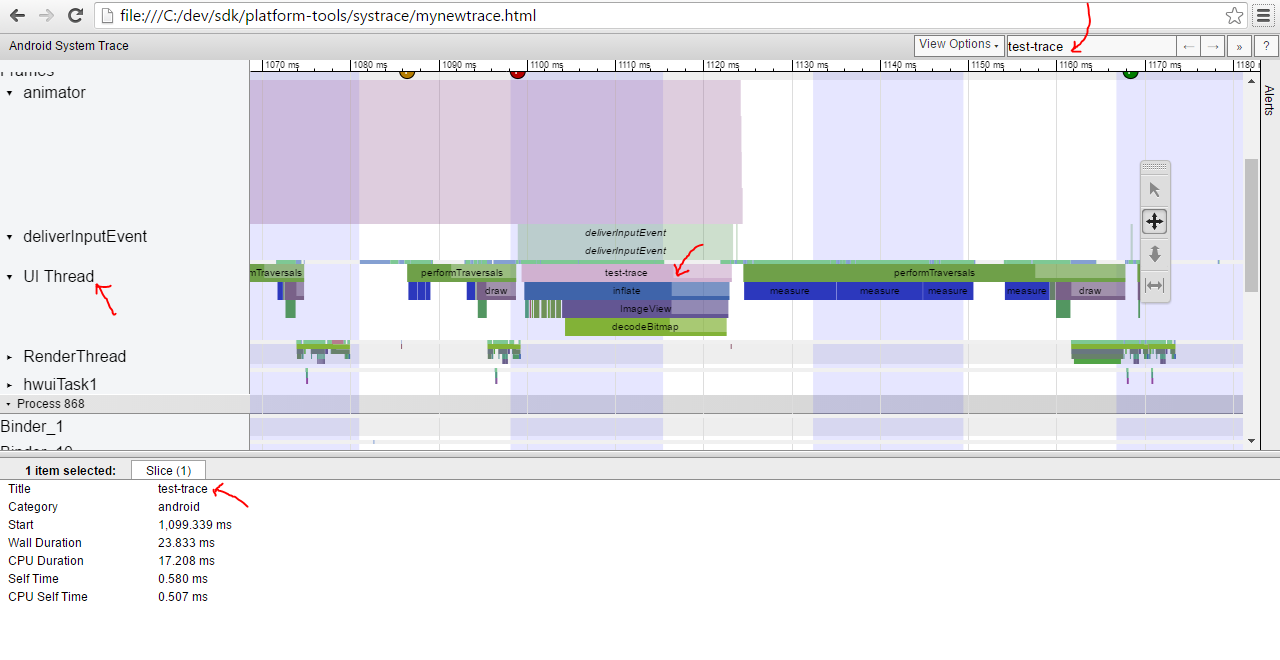
If you have only one thread, it's shown in UI thread row, otherwise it's shown in your-defined thread row.

If you can not find it, use the search toolbox, in top right corner of page, type 'test-trace' there and it will show you the start time of that in detail

this screenshot may help you:

screenshot for system trace

Transarctic answered 3/5, 2016 at 10:46 Comment(0)
J
3

The systrace output only includes the tags that are listed on the command line. For app-specific tracing, that means adding a --app=package-name argument. This is necessary because systrace logs the entire system, and you wouldn't want it to automatically pick up the traces for every app and component.

You can find an example here. For a program with package name com.faddensoft.multicoretest, you would use a command line like:

python systrace.py --app=com.faddensoft.multicoretest gfx view sched dalvik

With that, your tracing should appear in the row of the thread that's issuing the trace calls. (Open the HTML file in a web browser; might need to use Chrome.)

Japheth answered 10/5, 2015 at 15:41 Comment(2)
I understood this but this doesn't answer my question can be more specificMayonnaise
I'm not sure how to be more specific. The tracing shows up in the row for the thread that's making the trace calls. Are you not seeing it there?Japheth
C
0

Probably you recorded too long, make sure to increase buffer size with -b command, or simply follow this example:

python systrace.py  -app=package_name sched freq idle am wm gfx view dalvik input binder_driver -t 30 -o test.html -b 30384
Cranial answered 26/6, 2018 at 4:25 Comment(0)

© 2022 - 2024 — McMap. All rights reserved.