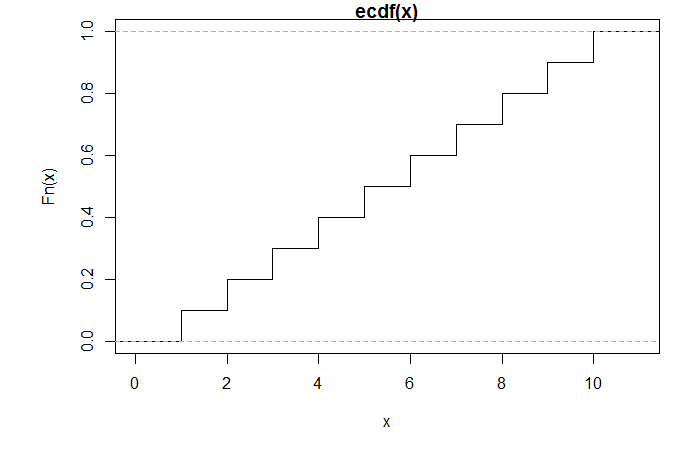
Plotting an ecdf object in R produces a nice empirical distribution function. E.g:
x = seq(1,10,1)
ecdf1 = ecdf(x)
plot(ecdf1,verticals=TRUE, do.points=FALSE)
However, the default behavior produces a figure with horizontal dotted lines at 0 and 1. I don't see an option to turn off this behavior in plot.ecdf() or in the underlying call to plot.stepfun(). Right now, I'm literally drawing a white line overtop the dotted lines.
Surely there's a way to turn off drawing these dotted lines?


colparameter can also be "transparent". – Rumanian