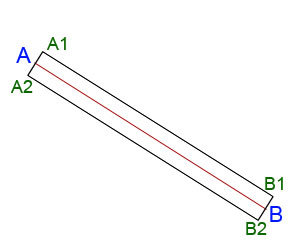
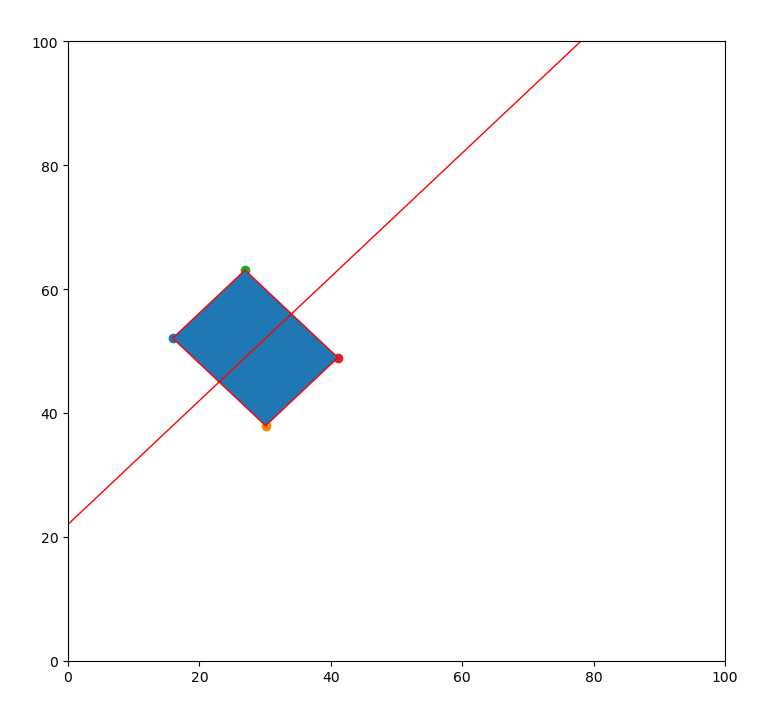
Here I am adding the python solution for @Yves Daoust answer
    import numpy as np
    import matplotlib.pyplot as plt
    import matplotlib.patches as patches

    fig = plt.figure()
    ax = fig.add_subplot(111)

    pt1 = np.array([23, 45])
    pt2 = np.array([34, 56])

    delta = pt2 - pt1
    distance = np.linalg.norm(delta)
    width = 20.0
    rect_x = 0.5*width*delta[0]/distance
    rect_y = 0.5*width*delta[1]/distance

    r1 = (pt1[0]-rect_y, pt1[1]+rect_x)
    r2 = (pt1[0] + rect_y, pt1[1]- rect_x)
    r3 = (pt2[0]-rect_y, pt2[1]+rect_x)
    r4 = (pt2[0] + rect_y, pt2[1]- rect_x)


    plt.xlim(0, 100)
    plt.ylim(0, 100)
    ax.axline((pt1[0], pt1[1]), (pt2[0], pt2[1]), linewidth=1, color='r')
    points = [r1, r2, r4, r3]
    rect = patches.Polygon(points, linewidth=1, edgecolor='r')
    ax.add_patch(rect)
    ax.scatter(x=r1[0], y=r1[1])
    ax.scatter(x=r2[0], y=r2[1])
    ax.scatter(x=r3[0], y=r3[1])
    ax.scatter(x=r4[0], y=r4[1])
    plt.show()
![enter image description here]()


