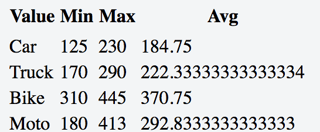
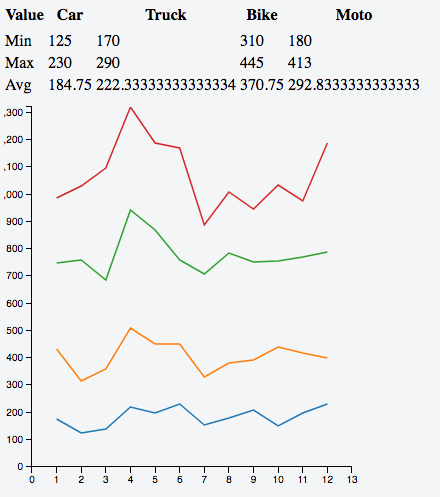
This is another solution that produce result closer to the requested ones although with much more code than Gordon's.
Intro
I agree with Gordon that there is no reasonable way to achieve what you want directly with crossfilter. Crossfilter is row oriented and you want to produce multiple rows basing on columns. So the only way is to make some "fake" step. And "fake" step implicitly mean that result will not be updated when the original datasource is changed. I see no way to fix it as crossfilter hides its implementation deatils (such as filterListeners, dataListeners, and removeDataListeners) well enough.
However dc is implemented in such a way that by default after various events all charts are redrawn (because they are all in the same global group). And because of this "fake objects" if properly implemented might be recalculated as well basing on the updated data.
Thus my code contains two implementations for min/max:
- fast(er) but unsafe if you don't do any additional filter
- slow(er) but safe in case you want additional filtering
Note that if you used fast but unasfe implementation and do additional filtering, you'll get exceptions and other features might get broken as well.
Code
All the code is available at https://jsfiddle.net/4kcu2ut1/1/. Let's separate it into logical blocks and see them one by one.
First go some helper methods and objects. Each Op object essentially contains methods necessary to pass to reduce + additional optional getOutput if the accumulator contains more data then just result such as the case for avgOp of min/max "safe" ops.
var minOpFast = {
    add: function (acc, el) {
        return Math.min(acc, el);
    },
    remove: function (acc, el) {
        throw new Error("Not supported");
    },
    initial: function () {
        return Number.MAX_VALUE;
    }
};

var maxOpFast = {
    add: function (acc, el) {
        return Math.max(acc, el);
    },
    remove: function (acc, el) {
        throw new Error("Not supported");
    },
    initial: function () {
        return Number.MIN_VALUE;
    }
};


var binarySearch = function (arr, target) {
    var lo = 0;
    var hi = arr.length;
    while (lo < hi) {
        var mid = (lo + hi) >>> 1; // safe int division
        if (arr[mid] === target)
            return mid;
        else if (arr[mid] < target)
            lo = mid + 1;
        else
            hi = mid;
    }
    return lo;
};

var minOpSafe = {
    add: function (acc, el) {
        var index = binarySearch(acc, el);
        acc.splice(index, 0, el);
        return acc;
    },
    remove: function (acc, el) {
        var index = binarySearch(acc, el);
        acc.splice(index, 1);
        return acc;
    },
    initial: function () {
        return [];
    },
    getOutput: function (acc) {
        return acc[0];
    }
};

var maxOpSafe = {
    add: function (acc, el) {
        var index = binarySearch(acc, el);
        acc.splice(index, 0, el);
        return acc;
    },
    remove: function (acc, el) {
        var index = binarySearch(acc, el);
        acc.splice(index, 1);
        return acc;
    },
    initial: function () {
        return [];
    },
    getOutput: function (acc) {
        return acc[acc.length - 1];
    }
};

var avgOp = {
    add: function (acc, el) {
        acc.cnt += 1;
        acc.sum += el;
        acc.avg = acc.sum / acc.cnt;
        return acc;
    },
    remove: function (acc, el) {
        acc.cnt -= 1;
        acc.sum -= el;
        acc.avg = acc.sum / acc.cnt;
        return acc;
    },
    initial: function () {
        return {
            cnt: 0,
            sum: 0,
            avg: 0
        };
    },
    getOutput: function (acc) {
        return acc.avg;
    }
};
Then we prepare source data and specify transformation we want. aggregates is a list of operations from the previous step additionally decorated with key to store temporary data in compound accumulator (it just has to be unique) and label to show in the output. srcKeys contains list of names of properties (all of which must be of the same shape) that will be processed by each operation from the aggregates lits.
var myCSV = [
    {"shift": "1", "date": "01/01/2016/08/00/00", "car": "178", "truck": "255", "bike": "317", "moto": "237"},
    {"shift": "2", "date": "01/01/2016/17/00/00", "car": "125", "truck": "189", "bike": "445", "moto": "273"},
    {"shift": "3", "date": "02/01/2016/08/00/00", "car": "140", "truck": "219", "bike": "328", "moto": "412"},
    {"shift": "4", "date": "02/01/2016/17/00/00", "car": "222", "truck": "290", "bike": "432", "moto": "378"},
    {"shift": "5", "date": "03/01/2016/08/00/00", "car": "200", "truck": "250", "bike": "420", "moto": "319"},
    {"shift": "6", "date": "03/01/2016/17/00/00", "car": "230", "truck": "220", "bike": "310", "moto": "413"},
    {"shift": "7", "date": "04/01/2016/08/00/00", "car": "155", "truck": "177", "bike": "377", "moto": "180"},
    {"shift": "8", "date": "04/01/2016/17/00/00", "car": "179", "truck": "203", "bike": "405", "moto": "222"},
    {"shift": "9", "date": "05/01/2016/08/00/00", "car": "208", "truck": "185", "bike": "360", "moto": "195"},
    {"shift": "10", "date": "05/01/2016/17/00/00", "car": "150", "truck": "290", "bike": "315", "moto": "280"},
    {"shift": "11", "date": "06/01/2016/08/00/00", "car": "200", "truck": "220", "bike": "350", "moto": "205"},
    {"shift": "12", "date": "06/01/2016/17/00/00", "car": "230", "truck": "170", "bike": "390", "moto": "400"},
];

var dateFormat = d3.time.format("%d/%m/%Y/%H/%M/%S");

myCSV.forEach(function (d) {
    d.date = dateFormat.parse(d.date);
    d['car'] = +d['car'];
    d['bike'] = +d['bike'];
    d['moto'] = +d['moto'];
    d['truck'] = +d['truck'];
    d.shift = +d.shift;
});

//console.table(myCSV);

var aggregates = [
    // not compatible with addtional filtering
    /*{
        key: 'min',
        label: 'Min',
        agg: minOpFast
    },**/
    {
        key: 'minSafe',
        label: 'Min Safe',
        agg: minOpSafe
    },
    // not compatible with addtional filtering
    /*{
        key: 'max',
        label: 'Max',
        agg: maxOpFast
    },*/
    {
        key: 'maxSafe',
        label: 'Max Safe',
        agg: maxOpSafe
    },
    {
        key: 'avg',
        agg: avgOp,
        label: 'Average'
    }
];

var srcKeys = ['car', 'bike', 'moto', 'truck'];
And now to the magic. buildTransposedAggregatesDimension is what does all the heavy work here. Essentially it does two steps:
First groupAll to get aggregated data for each combination in a cross product of all operatins and all keys.
Split the mega-object grouped to an array that can be a data-source for another crossfilter
Step #2 is where my "fake" is. It seems to me as much less "fake" than in Gordon's solution as it doesn't rely on any internal details of crossfilter or dc (see bottom method in Gordon's solution).
Also splitting at step #2 is where data is actually transposed to meet your requirements. Obviously, the code can be easily modified to do not do it and produce results in the same way as in Gordon's solution.
Note also that it is important that additional step does no additional calculations and only just transforms already computed values to appropriet format. This is crucial for update after filtering to work because in such ay table bound to the result of buildTransposedAggregatesDimension is still effectively bound to the original crossfilter datasource.
var buildTransposedAggregatesDimension = function (facts, keysList, aggsList) {
    // "grouped" is a single record with all aggregates for all keys computed
    var grouped = facts.groupAll()
            .reduce(
            function add(acc, el) {
                aggsList.forEach(function (agg) {
                    var innerAcc = acc[agg.key];
                    keysList.forEach(function (key) {
                        var v = el[key];
                        innerAcc[key] = agg.agg.add(innerAcc[key], v);
                    });
                    acc[agg.key] = innerAcc;
                });
                return acc;
            },
            function remove(acc, el) {
                aggsList.forEach(function (agg) {
                    var innerAcc = acc[agg.key];
                    keysList.forEach(function (key) {
                        var v = el[key];
                        innerAcc[key] = agg.agg.remove(innerAcc[key], v);
                    });
                    acc[agg.key] = innerAcc;
                });
                return acc;
            },
            function initial() {
                var acc = {};
                aggsList.forEach(function (agg) {
                    var innerAcc = {};
                    keysList.forEach(function (key) {
                        innerAcc[key] = agg.agg.initial();
                    });
                    acc[agg.key] = innerAcc;
                });
                return acc;
            }).value();

    // split grouped back to array with element for each aggregation function
    var groupedAsArr = [];
    aggsList.forEach(function (agg, index) {
        groupedAsArr.push({
            sortIndex: index, // preserve index in aggsList so we can sort by it later
            //agg: agg,
            key: agg.key,
            label: agg.label,
            valuesContainer: grouped[agg.key],
            getOutput: function (columnKey) {
                var aggregatedValueForKey = grouped[agg.key][columnKey];
                return agg.agg.getOutput !== undefined ?
                        agg.agg.getOutput(aggregatedValueForKey) :
                        aggregatedValueForKey;
            }
        })
    });
    return crossfilter(groupedAsArr).dimension(function (el) {   return el;    });
};
Small helper method buildColumns creates columns for each original key in srcKeys + additional column for the label of operations
var buildColumns = function (srcKeys) {
    var columns = [];
    columns.push({
        label: "Aggregate",
        format: function (el) {
            return el.label;
        }
    });
    srcKeys.forEach(function (key) {
        columns.push({
            label: key,
            format: function (el) {
                return el.getOutput(key);
            }
        });
    });
    return columns;
};
So now let's get all together and create a table.
var facts = crossfilter(myCSV);
var aggregatedDimension = buildTransposedAggregatesDimension(facts, srcKeys, aggregates);
dataTable = dc.dataTable('#dataTable'); // put such a <table> in your HTML!

dataTable
        .width(500)
        .height(400)
        .dimension(aggregatedDimension)
        .group(function (d) { return ''; })
        .columns(buildColumns(srcKeys))
        .sortBy(function (el) { return el.sortIndex; })
        .order(d3.ascending);

//dataTable.render();
dc.renderAll();
There is also additional piece of code shamelessly stolen from Gordon to add a line chart for additional filtering.


