I am trying to draw a Bsyesian Network in R with bnlearn. Here is the my R code
library(bnlearn)
library(Rgraphviz)

first_variable <- rnorm(100)
second_variable <- rnorm(100)
third_variable <- rnorm(100)
v <- data.frame(first_variable,second_variable,third_variable)

b <- hc(v)
hlight <- list(nodes = nodes(b), arcs = arcs(b),col = "grey", textCol = "red")
pp <- graphviz.plot(b, highlight = hlight)
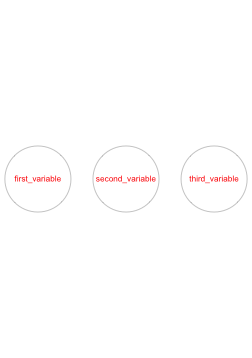
The code above works, but the size of the text in the plot is very smaller than I expected. Here it is:
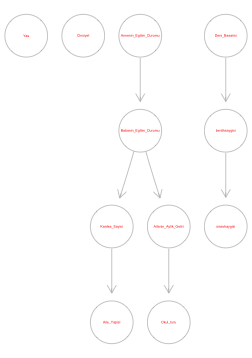
I think that is because my variables have long names . In my real data, the variable names are even longer. Here is the BN plot for my real dataset:
Is there any way to increase the size of the text in the plot?


