How to save a table I created with (DT), datatable into a high quality image?
Asked Answered
S

1

5

I created a datatable that can be viewed in my "Viewer". If I use export to copy the image or save is as a .png it tends to be really low quality?

My best option has been screenshotting the image and pasting it to my work document where I type out my report, but I know there has to be a better way.

Any advice on what I can do?

Stomodaeum answered 18/2, 2020 at 18:53 Comment(0)
C
9

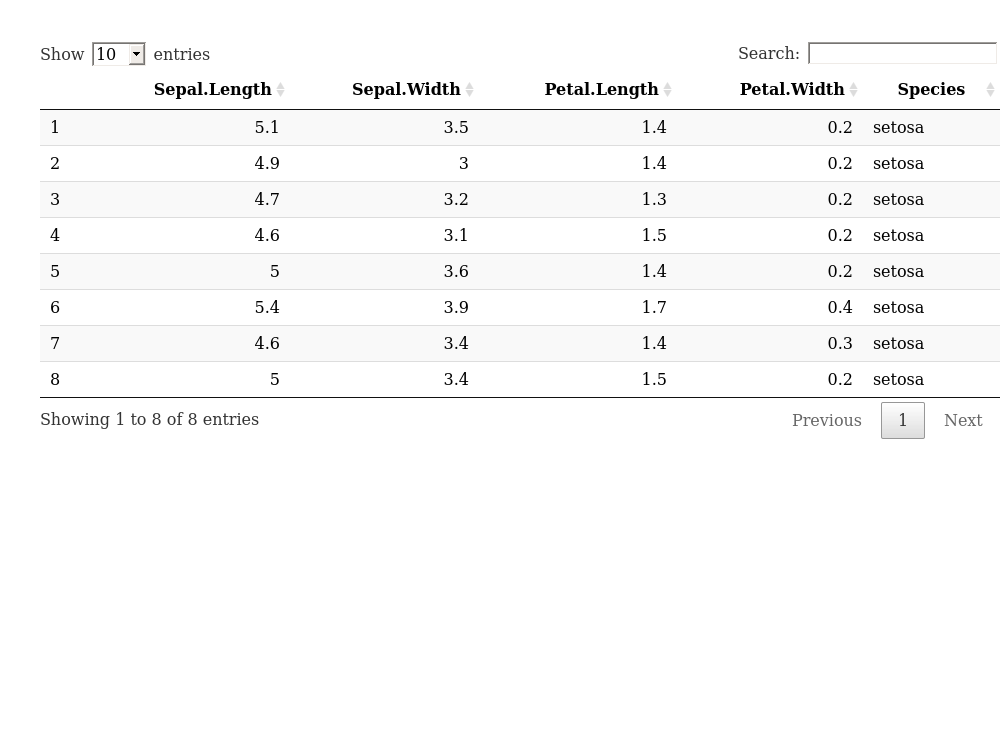
You can use the saveWidget function to save the datatable in a html file, then use the webshot package to take a snapshot.

library(DT)
library(webshot)
dtable <- datatable(iris[1:8,])
html <- "dtable.html"
saveWidget(dtable, html)
webshot(html, "dtableSnapshot.png") # you can also export to pdf

enter image description here

Cuellar answered 18/2, 2020 at 19:31 Comment(3)
Great question and great answer! would that work with R plotly graphs as well?Autonomous
@Autonomous I think so, because a plotly graph is a htmlwidget as well. But I don't think that using this way would generate a plot with a higher quality than the one you get with the download button.Kristakristal
Thank you @Stephane Laurent ! The issue I face on my end is that I have built a huge shiny app. Now, I need to create an overnight pdf report using rmarkdown and add there some of plots usually created on the fly within the shiny app. Hence, I guess I have to copy all the R code I created for the shiny app but I still need a way to save the R plotly graphs as png. What do you think ?Autonomous

© 2022 - 2024 — McMap. All rights reserved.