conditionally bold values in flextable
Asked Answered
G

3

5

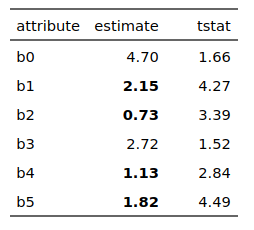
Is it possible to bold/color estimate values based on tstat.

For ex - bold estimate values if tstat is more than 1.96

This is in continuation of my previous question and I have to use flextable.

library(dplyr)
library(flextable)


attribute <- c("b0", "b1", "b2", "b3", "b4", "b5")
estimate <- round(runif(n = 6, min = 0, max = 5), 2)
tstat <- round(runif(n = 6, min = 0, max = 5), 2)

# tibble
tbl <- tibble(attribute, estimate, tstat) %>%
  as_flextable()

Geoffreygeoffry answered 30/10, 2021 at 22:18 Comment(2)
A, B, C, D, E, F :-)Shiprigged
@akrun sorry I have removed itGeoffreygeoffry
L
5

Another solution using flextable row selector:

library(dplyr)
library(flextable)

set.seed(4123)

attribute <- c("b0", "b1", "b2", "b3", "b4", "b5")
estimate <- round(runif(n = 6, min = 0, max = 5), 2)
tstat <- round(runif(n = 6, min = 0, max = 5), 2)

tbl <- tibble(attribute, estimate, tstat)

tbl %>%   
  flextable() %>% 
  bold(~ tstat > 1.96,2)

enter image description here

Lachish answered 1/11, 2021 at 11:25 Comment(2)
tbl %>% flextable() %>% flextable::bold(~ tstat > 1.96,2) - that was essential in my case to specify exactly which library it is from as crayon and gt libraries were also active within the same R session and all of then had function bold()Bode
@Bode if only I saw this earlier, it would have saved me hours of debugging just now!Cliftonclim
M
2

We could use either ifelse or case_when to add the **<value>** for bolding

library(dplyr)
library(flextable)
tbl <- tibble( attribute, estimate, tstat) %>%
       mutate(estimate = case_when(tstat > 1.96 
            ~sprintf('**%0.2f**', estimate), 
          TRUE  ~sprintf('%0.2f', estimate))) %>%
  as_flextable() %>%
  colformat_md()
tbl

-output

enter image description here

Measure answered 30/10, 2021 at 22:24 Comment(2)
okay thanks a lot, although I have to bold the estimate value based on tstatGeoffreygeoffry
@SiD that is easier, just change it to estimate based on the comparision on tstat'. updatedMeasure
P
2

Another solution:

library(dplyr)
library(flextable)

set.seed(4123)

attribute <- c("b0", "b1", "b2", "b3", "b4", "b5")
estimate <- round(runif(n = 6, min = 0, max = 5), 2)
tstat <- round(runif(n = 6, min = 0, max = 5), 2)

tbl <- tibble(attribute, estimate, tstat)
  
tbl %>%   
  flextable() %>% 
  bold(tbl$tstat > 1.96,2)

enter image description here

Pollack answered 30/10, 2021 at 23:4 Comment(0)

© 2022 - 2024 — McMap. All rights reserved.