How to automatically determine the background color of an RGBA image with highest contrast?
Asked Answered
R

2

5

Background

I have a bunch of RGBA images. Imagine icons, logos or similar images that I would like to display. These images can be of any color. Please also note that the images are RGBA, so they have the fourth alpha channel for transparency.

Complication

Initially, I showed the images all on a white background. However, sometimes the whole image or parts of it were white, so these areas looked empty to the user.

The problem is that images are not all-white or all-black. There may be multiple colors and color gradients. And, due to the way RGBA images work, pixels are not always all one color and all opaque. Even if an image just showed a pure black icon in the center, there may be transition areas at the edges of the black icon with pixels of some transparency or more greyish colors.

Question

Assume, for each image I can choose between a black, grey, or white background. How can I algorithmically determine which of the three background color options is the best for any individual RGBA image?

By "best" I mean that no areas of the image should falsely appear empty and the highest contrast between image and background is achieved.

Example

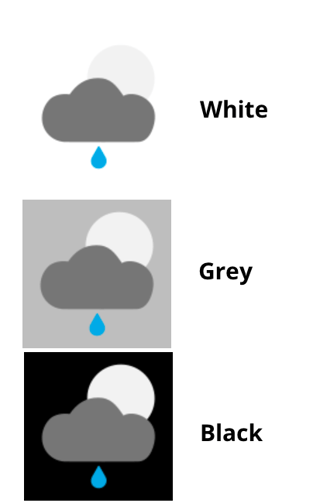
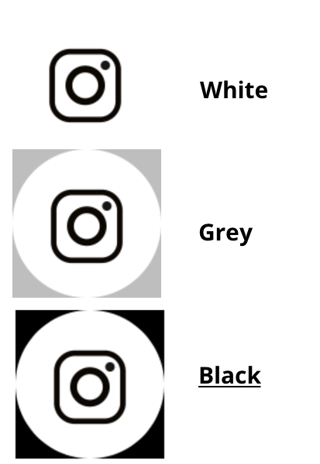
In the toy example below, the icon I want to show has a white circle around it. So I cannot use white as a background color. I need to choose grey or black. Black would be best since it maximises contrast.

Toy example 1

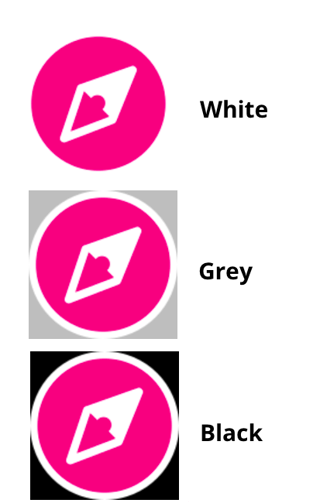
In the second toy example things are slightly more complicated since multiple areas of different color directly touch the transparent areas of the image. The black background appears to have the highest contrast but it is no longer trivial.

Toy example 1

Ideas

  • The inner parts of opaque areas do not matter. The background color would not affect the visibility.
  • The inner parts of the fully transparent areas do not matter. There is nothing that could be made invisible.
  • I would probably need to find those pixels in these transition areas between opaque and transparent. And then determine the color of these.

This appears awfully inefficient. Since most icons, logos, etc. have been designed for either a bright or a dark background, maybe it is sufficient to sample just a few pixels in the transition area between opaque and transparent?

I feel I am reinventing the wheel and someone must have found a solution to this problem before.

Existing questions on Stackoverflow

  • I found existing questions on determining the best font color given a background color. However my problem is different. The problems I saw were only dealing with maximising the contrast between only two simple RGB colors.

Additional example 3

Note how this logo has a fine white line around it. This implies the optimal background color should probably be black.

enter image description here

Examples to play around with

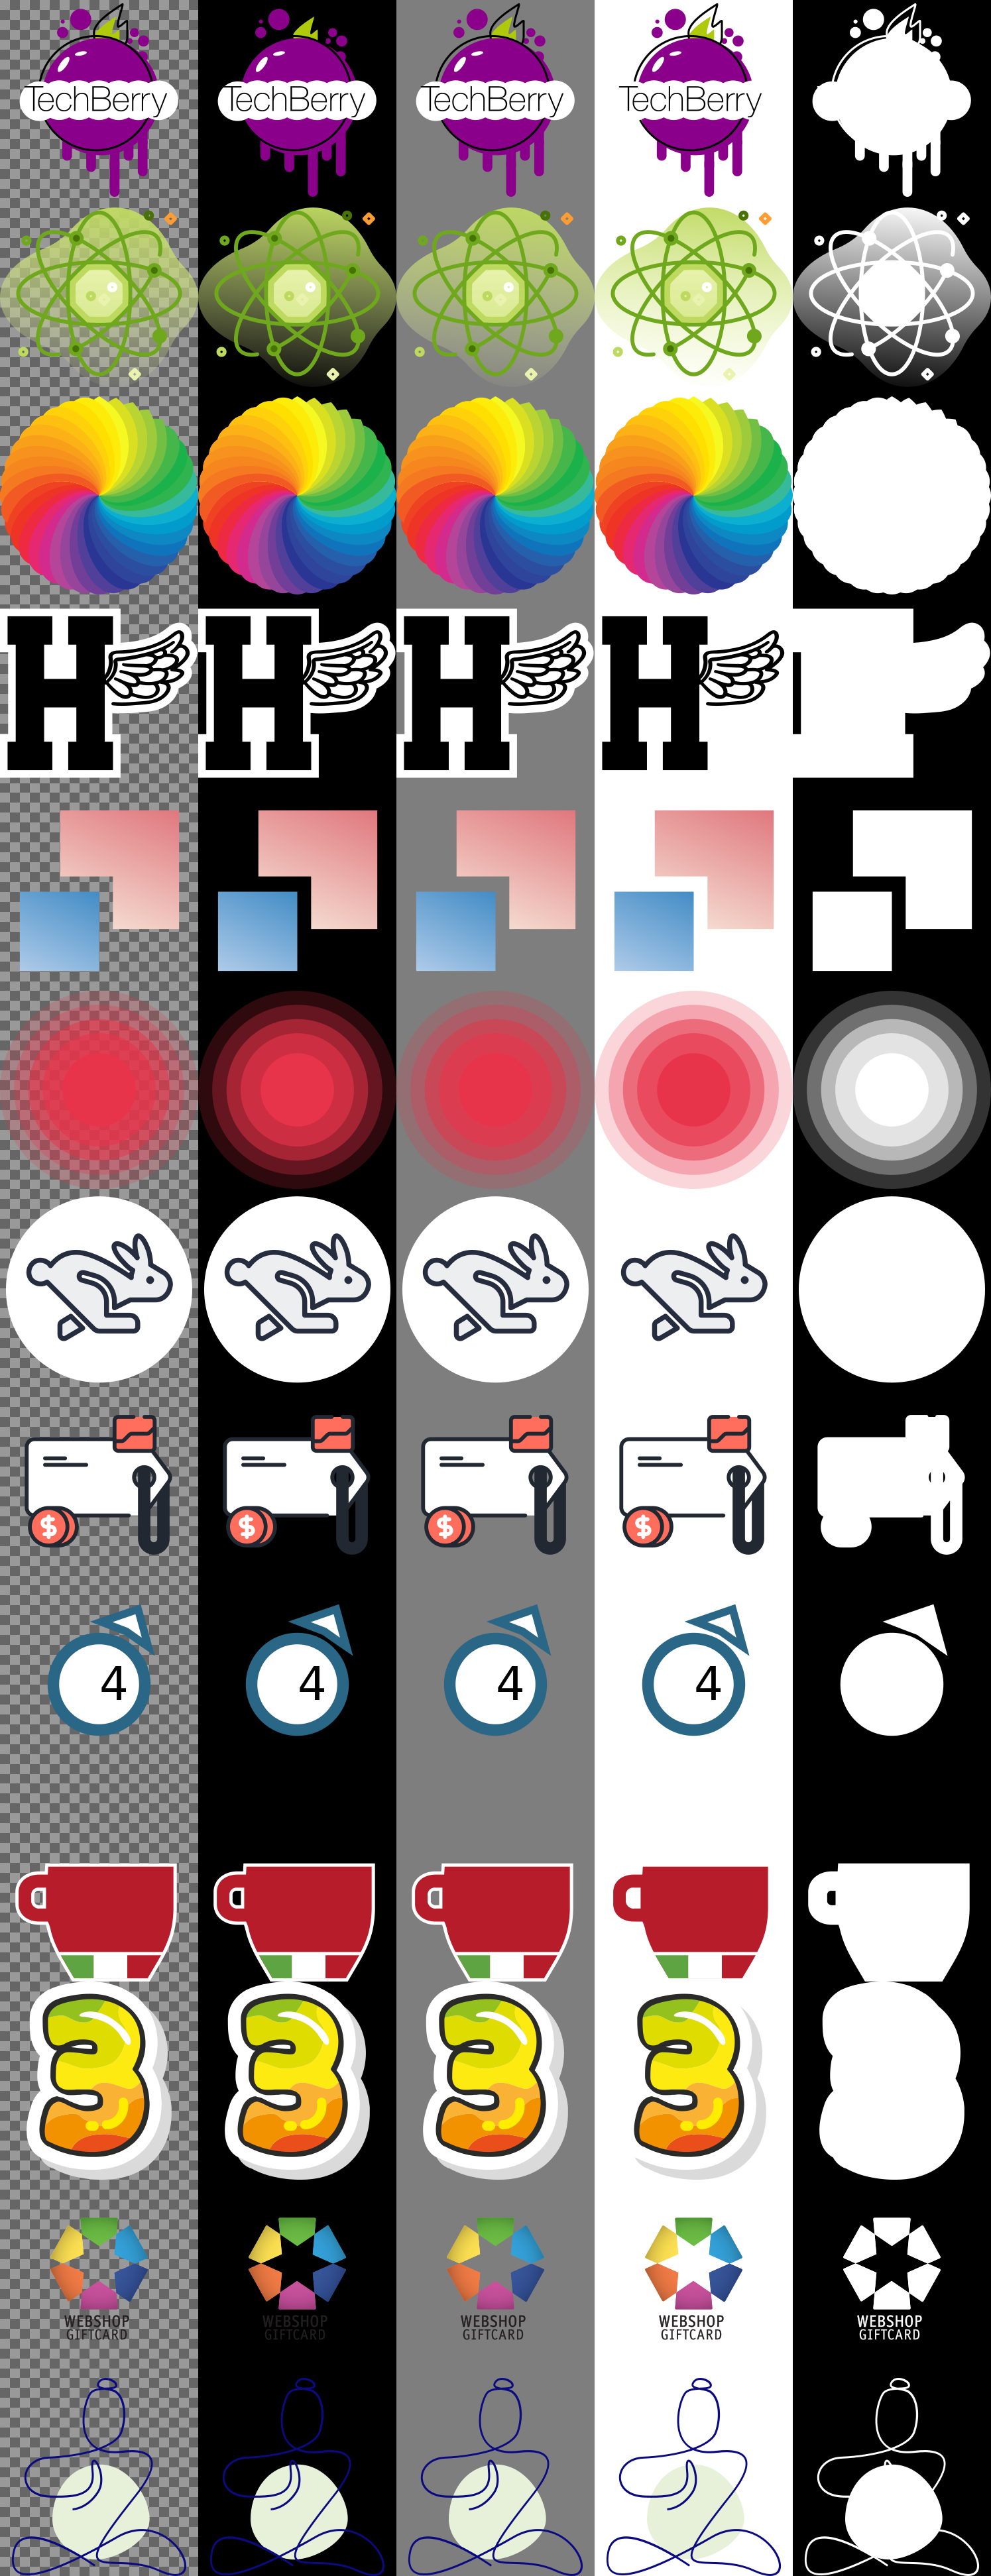
Here are a dozen or so RGBA images to play around with. I don't own the copyright -- this is just for the illustration of the problem. Google Drive link

Edited in by Mark Setchell

I have added all sample images, going left-to-right as follows:

  • over a chessboard to show transparent areas
  • over black background
  • over grey background
  • over white background
  • with just the alpha channel extracted
enter image description here

Rinker answered 10/5, 2022 at 23:34 Comment(6)
Sorry, I don't understand your second example at all. Why does it matter what is touching what? Why do you say the black background "appears to have the greatest contrast"? It does have the greatest contrast. What do you mean by "transition area" please? Thank you.Sardinia
Sorry for not having expressed myself clearly @MarkSetchell. (1) I wanted to say that computing optimal background colors becomes non-trivial if there are multiple areas of different color directly bordering the transparent image parts. (2) The black background has the greatest contrast in the example. I was just phrasing it carefully since I did not know if it was just my perception. (3) By "transition area" I meant pixels that are located between a fully transparent area and a fully opaque, colored area. These pixels may have half-transparent alpha values or lighter colors.Rinker
Maybe you can share 4-5 original, actual input images without them being superimosed on a white background so that we can try out processing ideas on them? If you shared the corresponding expected result, separately, that would also help. Thank you.Sardinia
Excellent comment @MarkSetchell. I have added a GDrive link at the bottom of my original post. These should illustrate different aspects of the complexity.Rinker
Feel free to delete or reverse out my edits if you dislike them for any reason.Sardinia
You might try getting the average color of the boundary between opaque and transparent. You can get the boundary from -morphology edgein on the alpha channel. Use that as a mask to get the average color in the image along the boundary. Then choose your background color appropriately.Recapture
Z
6

The idea is to calculate the most "dominant" color of an image then choose the corresponding background color most opposite to the strongest color present in the image. Since we can only choose white, gray, or black; we can assume the best color to maximize contrast is equal to the color that is polar opposite to the most dominant color. Here's an approach using K-Means Clustering to determine the dominant colors of an image with sklearn.cluster.KMeans()


The three possible RGB color codes we can choose are:

White: rgb(255, 255, 255)
Gray: rgb(128, 128, 128)
Black: rgb(0, 0, 0)

We can calculate the best color by finding the average of the dominant color and categorize it between color zones. Since a color channel ranges from [0 - 255], we can simply split it into three quadrants:

# Find best color
if dominant_color_average <= 85:
    print('White!')
elif dominant_color_average > 85 and dominant_color_average <= 170:
    print('Gray!')
elif dominant_color_average > 170:
    print('Black!')

Here are some examples:

With n_clusters=5, here are the most dominant colors and percentage distribution

[217 215 213] 2.66%
[158 156 154] 2.80%
[84 82 79] 3.02%
[19 16 14] 6.87%
[254 254 254] 84.66%

Visualization of each color (on a dark background so you can see the white)

Results

Dominant color: [254, 254, 254]
Dominant color average: 254
Black!

The second image

With n_clusters=5, here are the most dominant colors and percentage distribution

[ 27 172 221] 0.84%
[179 186 188] 1.99%
[239 241 241] 10.98%
[118 118 118] 21.18%
[254 254 254] 65.02%

Visualization of each color (on a dark background so you can see the white)

Results

Dominant color: [254, 254, 254]
Dominant color average: 254
Black!

Both of your example logos have dominant white colors therefore the best background should be black. There could be a more interesting way of calculating the best color but I'll leave that up to you.


Results with logos that are not dominantly white

enter image description here

[249 247 249] 8.34%
[197  46 140] 21.02%
[173  74 213] 22.45%
[149 150 215] 22.68%
[205 103  84] 25.51%

Dominant color: [205, 103, 84]
Dominant color average: 130
Gray!

enter image description here

[220 246 246] 0.84%
[ 25 210 234] 11.26%
[  8  74 111] 22.17%
[  7 126 175] 23.17%
[ 2 28 45] 42.56%

Dominant color: [2, 28, 45]
Dominant color average: 25
White!

enter image description here

[120 180 218] 2.51%
[  2  89 148] 5.76%
[245 245 248] 8.51%
[237  29  59] 11.43%
[  0 123 196] 71.79%

Dominant color: [0, 123, 196]
Dominant color average: 106
Gray!

enter image description here

[ 17 124 143] 1.53%
[26 75 84] 1.74%
[  7 173 203] 1.84%
[  0 215 254] 22.30%
[33 34 34] 72.58%

Dominant color: [33, 34, 34]
Dominant color average: 33
White!

Code

import cv2
import numpy as np
from sklearn.cluster import KMeans

def visualize_colors(cluster, centroids, exact=False):
    # Get the number of different clusters, create histogram, and normalize
    labels = np.arange(0, len(np.unique(cluster.labels_)) + 1)
    (hist, _) = np.histogram(cluster.labels_, bins = labels)
    hist = hist.astype("float")
    hist /= hist.sum()
    
    # Convert each RGB color code from float to int
    if not exact:
        centroids = centroids.astype("int")
    
    # Create frequency rect and iterate through each cluster's color and percentage
    rect = np.zeros((50, 300, 3), dtype=np.uint8)
    colors = sorted([(percent, color) for (percent, color) in zip(hist, centroids)])
    start = 0
    for (percent, color) in colors:
        print(color, "{:0.2f}%".format(percent * 100))
        end = start + (percent * 300)
        cv2.rectangle(rect, (int(start), 0), (int(end), 50), \
                      color.astype("uint8").tolist(), -1)
        start = end
    return colors, rect

# Load image and convert to a list of pixels
image = cv2.imread('1.png')
image = cv2.cvtColor(image, cv2.COLOR_BGR2RGB)
reshape = image.reshape((image.shape[0] * image.shape[1], 3))

# Find and display most X dominant colors
cluster = KMeans(n_clusters=5).fit(reshape)
colors, visualize = visualize_colors(cluster, cluster.cluster_centers_)
visualize = cv2.cvtColor(visualize, cv2.COLOR_RGB2BGR)

# Obtain dominant RGB color code
dominant_color = colors[-1][1].tolist()
dominant_color_average = int(sum(dominant_color) / 3)
print('Dominant color:', dominant_color)
print('Dominant color average:', dominant_color_average)

# Find best color
if dominant_color_average <= 85:
    print('White!')
elif dominant_color_average > 85 and dominant_color_average <= 170:
    print('Gray!')
elif dominant_color_average > 170:
    print('Black!')

cv2.imshow('visualize', visualize)
cv2.waitKey()
Zooid answered 11/5, 2022 at 0:51 Comment(6)
I absolutely love the detailed answer of yours and appreciate that you spent the time to help me, @nathancy. However, I don't think determining the dominant color is sufficient. My objective is to not lose any visual information by choosing the wrong background color. Imagine if in my example 1 (the instagram logo), there was not a circle around the black icon. Image, there would just be a thin white line around the black icon. In that case, the most dominant color would have been black. And thus the polar opposite color suggested as background would have been white. Am I wrong?Rinker
I have added a third example in my original post to clarify my comment. I don't think computing the dominant color would do the trick here, or did I misunderstand?Rinker
I have also added a GDrive link to further original RGBA examples which hopefully illustrate the problems I see...Rinker
I still think finding the dominant color is necessary to know the underlying color composition of the image otherwise you don't have an objective basis to decide what background color to use although it shouldn't be the only metric. One thing you could do is to add additional parameter checks such as slicing the outer borders of the logo to see if there are conflicting colors, something like a weighted point system. The dominant color could be like 60% of the scale and color on border the other 40% to decide what to useZooid
I don't think the dominant color is a necessary input for the decision on the background color. I am not deciding which background color is the most beautiful one given the image. I just need to decide if black, grey, or white is the background color that allows the viewer to see the image best (without parts getting made invisible). Take the new example in the post: the logo consisting of an H with wings. The dominant color is black. But due to the white outline everywhere, it is clear that the background color needs to be the polar opposite of white: black.Rinker
Yes that's why take like a 20% border ROI and use it as a secondary input to determine the background color based on highest contrast. For that example with the logo with H, the determined color is white which is incorrect so by taking the outer ROI as another input, you can invalidate the primary choice and instead go down the list for the next best contrastZooid
S
3

This is more of a "work-in-progress", than a complete answer - but there is no requirement AFAIK for SO answers to be complete, and anyone else is welcome to take the idea and develop or adapt it.

So, whilst I have not yet come up with a full solution, I am attempting to address the part of your question that says "the inner parts of the opaque areas do not matter" and likewise the inner parts of the transparent areas. My idea is that if you can identify the parts that do and don't matter, you will be closer to a solution...

I am just using ImageMagick in the Terminal here, but you can do exactly the same things with Python if the approach proves useful. So, if I take your first image, I can extract the alpha channel like this:

magick example_1.png -alpha extract alpha.png

enter image description here

If I now add a 1-pixel wide black border all around the edges, I can do a flood-fill in red starting at 0,0 and the red will "flow" all around the edges along the new border and seep into the image from all sides but without ever reaching the inner islands of transparency. The reason for the border is in case the black touches the edge of the image, this allows a tiny 1-pixel channel for the flood to flow around the obstruction:

magick example_1.png -alpha extract -bordercolor black -border 1 -fill red -draw "color 0,0 floodfill" result.png

enter image description here

So, what I am saying is that the red pixels are the ones you think you are interested in... and what needs to happen next is the subject of further thought. I guess we could make the remaining black parts white:

magick example_1.png -alpha extract -bordercolor black -border 1 -fill red -draw "color 0,0 floodfill" -fill white -opaque black result.png

enter image description here

and push that back into the image as a new, modified alpha channel.


Here are a couple of other samples subjected to the same treatment so you can see where it is headed..

enter image description here

enter image description here

enter image description here

Sardinia answered 14/5, 2022 at 12:9 Comment(1)
Sorry for the late reply. I am working through your ideas in Python and will let you know.Rinker

© 2022 - 2024 — McMap. All rights reserved.