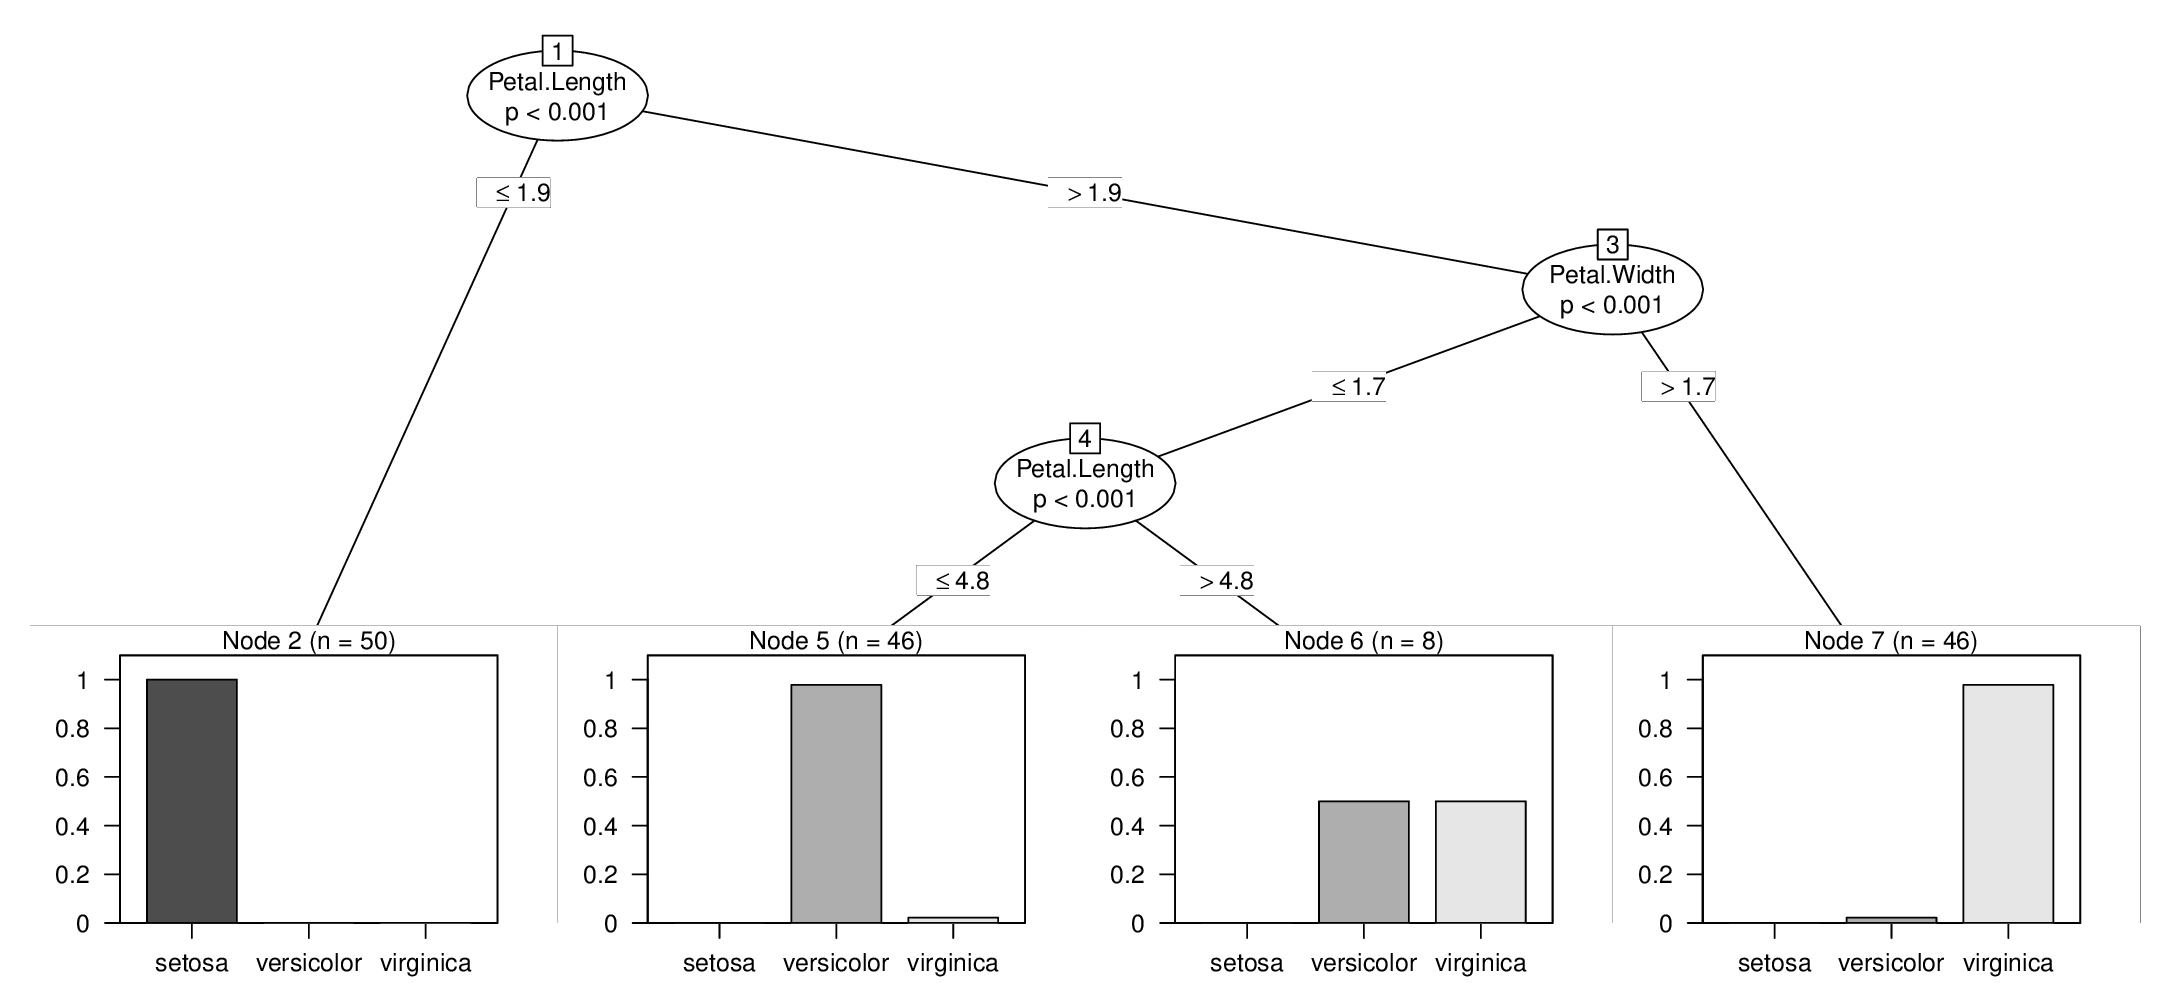
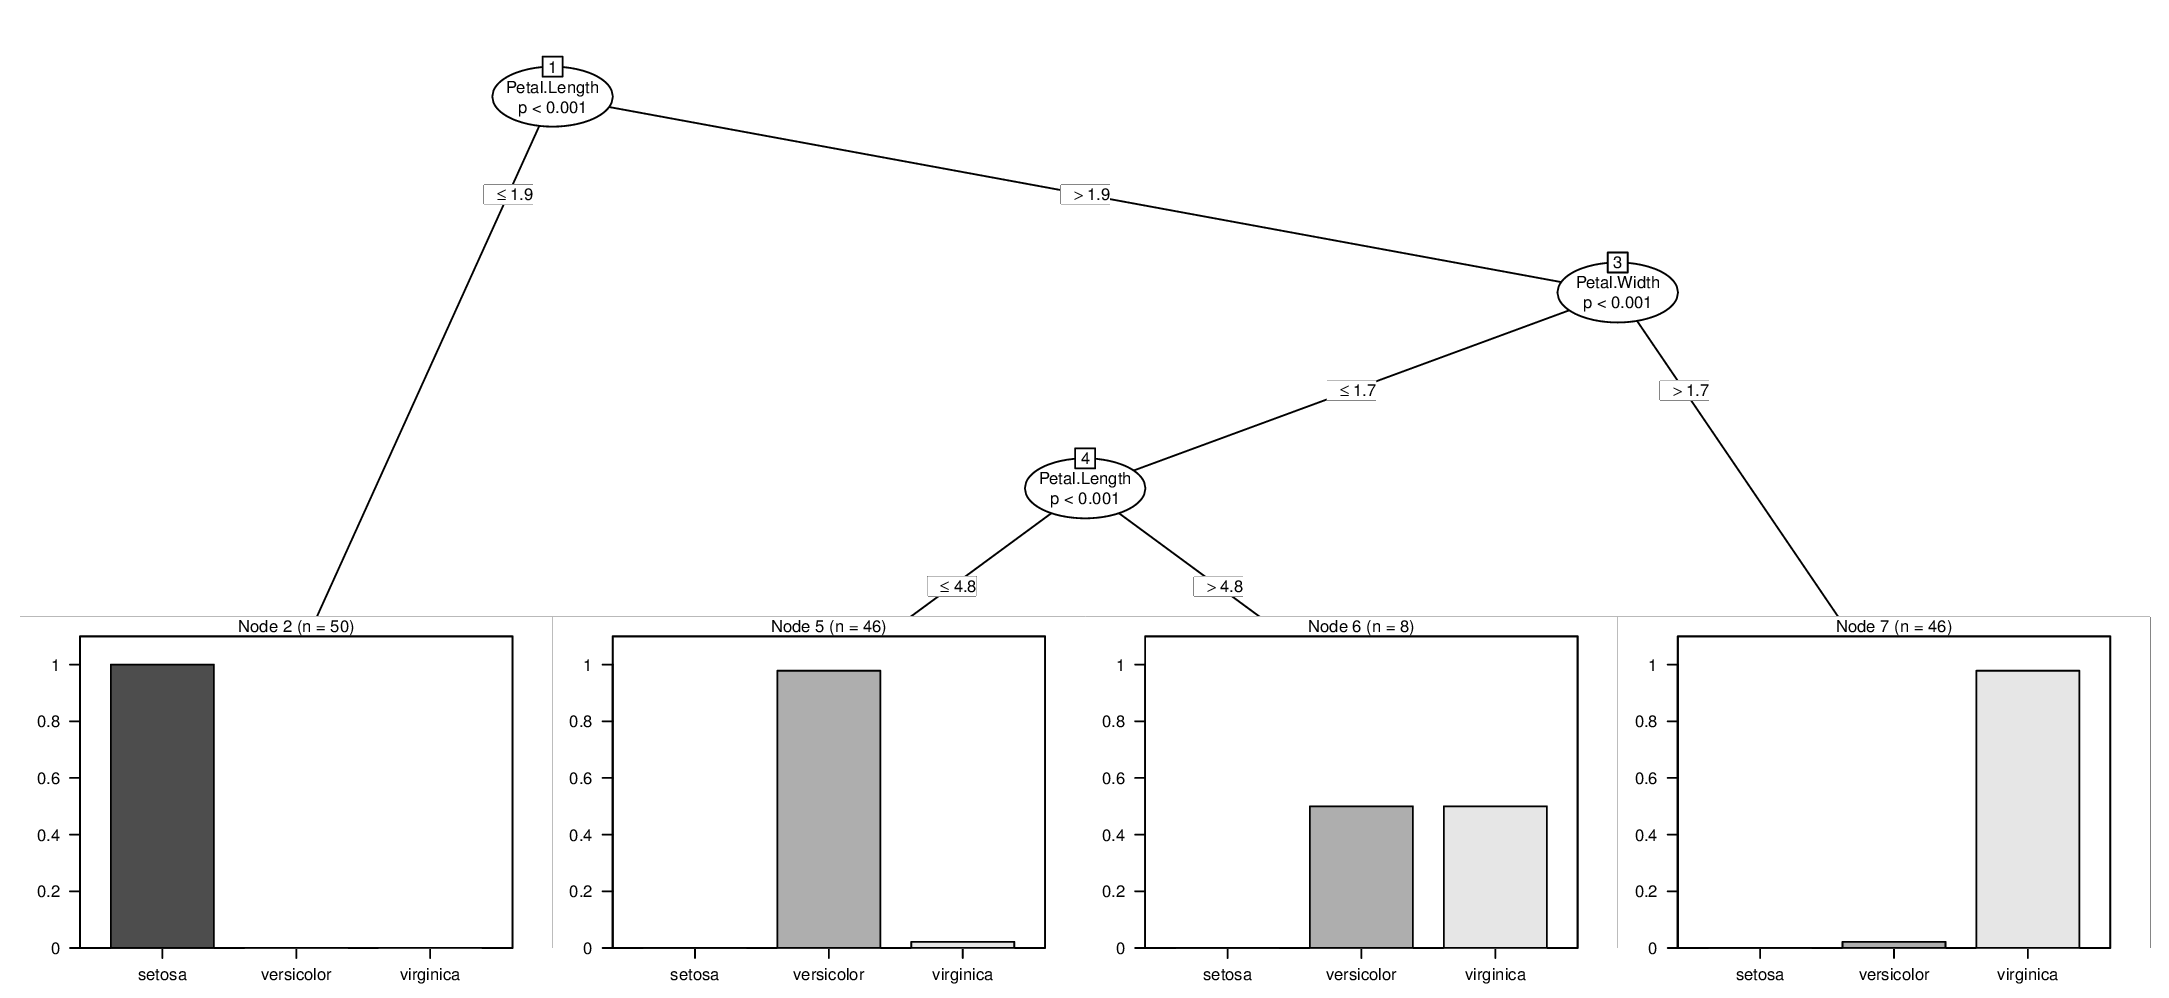
I need to insert conditional inference trees (plotted in party library of R) into a text of PhD thesis, that's why I have to tune all the graphical parameters.
I know that the optimal width is 700 (just because it fits the format of thesis to the best). The problem is that in this case one can't see the list of factors which leads to one or both nodes in a lower level of the tree.
I tried to specify cex parameter while plotting, but it gave me no effect. I need to lower the labels size at the plot. I'll appreciate any help.
The code looks like follows:
blgrcit <- ctree(Suffix ~ cluster + quality + declination, blgr)
jpeg("bulgarian_tree.jpeg", width = 700)
plot(blgrcit, cex = 0.4)
dev.off()


