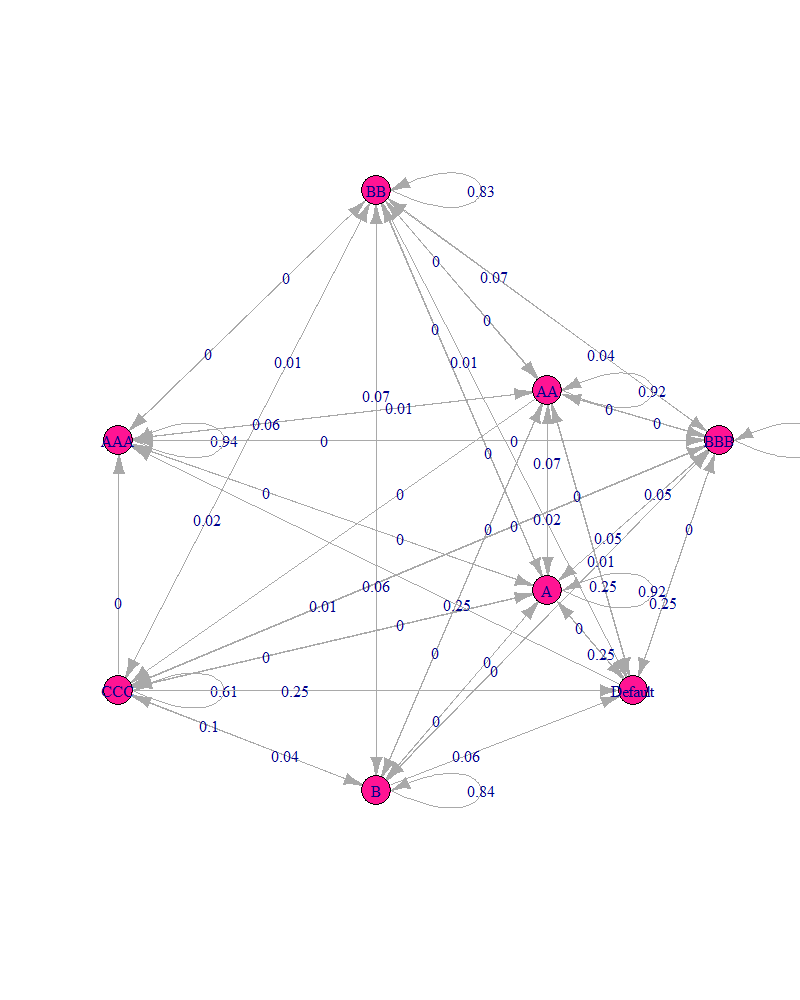
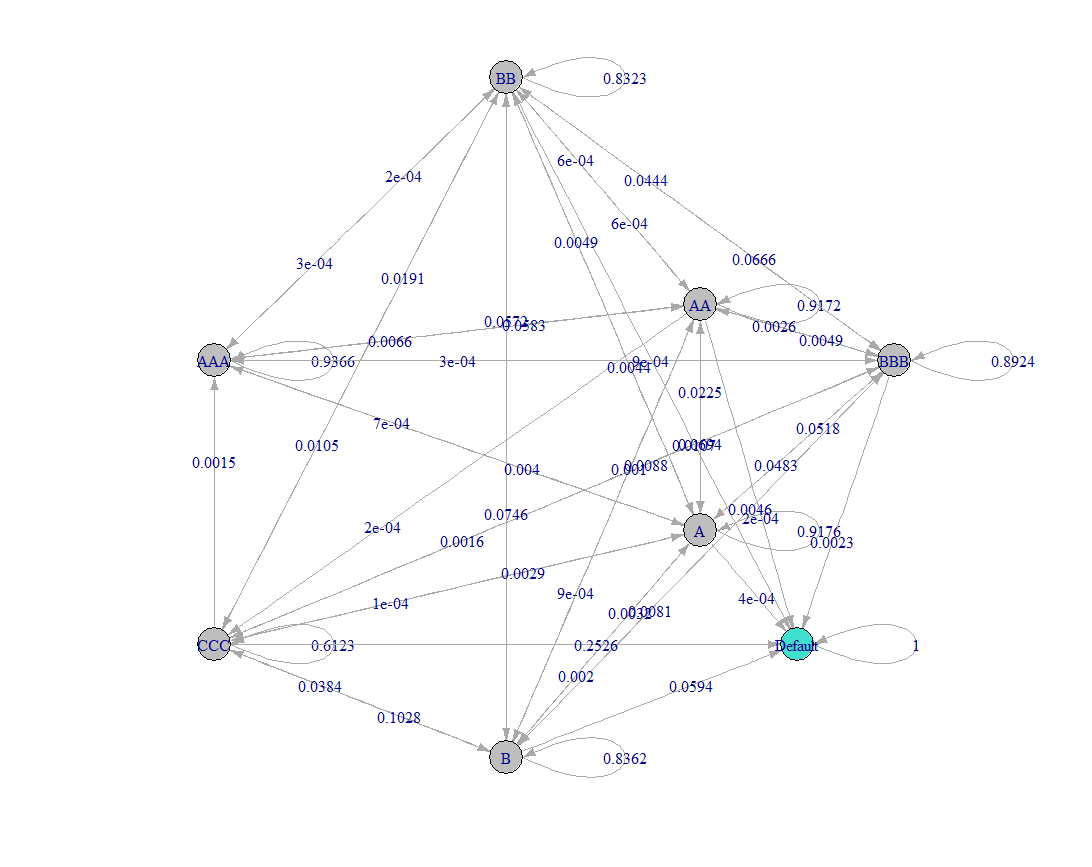
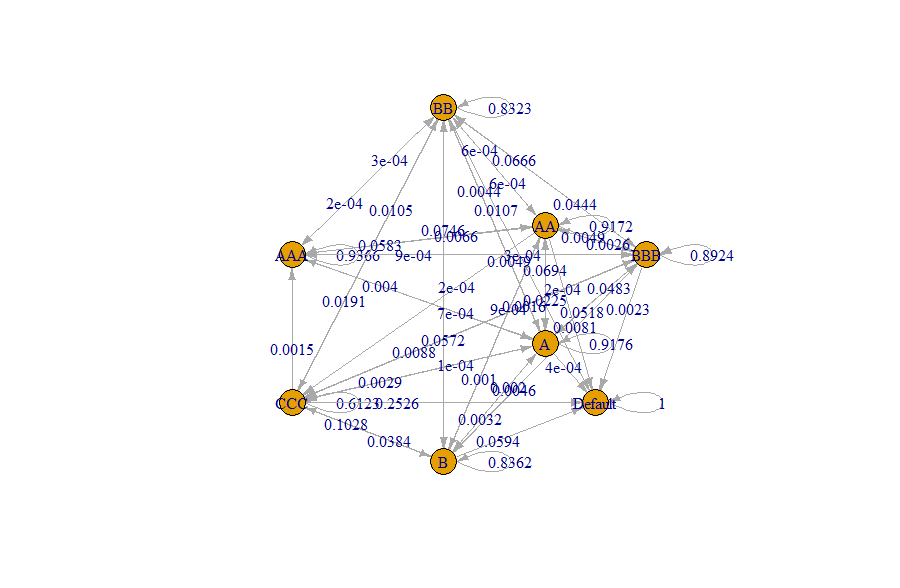
I have plotted a markov chain from a matrix in r. However, I have numerous probabilities under 0.01, and thus my probability plot looks something like this:
I've been searching for hours and I can't seem to find something that allows me to display all four decimal places. Is there any way to format this or should I leave it as is?
My code is as follows:
library(markovchain)

newtransition.matrix <- matrix( data = c(
  .9366, .0066, .0007, .0003 ,.0003, 0, .0015, 0,
  .0583, .9172, .0225, .0026, .0006, .001, 0, 0,
  .004, .0694, .9176, .0483, .0044, .0032, .0029, 0,
  .0009, .0049, .0518, .8924, .0666, .0046, .0088, 0,
  .0002, .0006, .0049, .0444, .8323, .0572, .0191, 0,
  0, .0009, .002, .0081, .0746, .8362, .1028, 0,
  0, .0002, .0001, .0016, .0105, .0384, .6123, 0,
  0, .0002, .0004, .0023, .0107, .0594, .2526, 1),
  nrow = 8, ncol = 8,
  dimnames = list( c( "AAA", "AA", "A", "BBB", "BB", "B", "CCC", "Default" ), c( "AAA", "AA", "A", "BBB", "BB", "B", "CCC", "Default") ) )
 print( newtransition.matrix )

newtransition.matrix <- new( "markovchain", transitionMatrix = newtransition.matrix )
layout <- matrix(c(-3, 1, 2, 2, 2, -2, 4, 1, 0, 6, 0, -6, -3, -4, 3, -4), ncol = 2, byrow = TRUE)

plot(newtransition.matrix, vertex.size = 10, layout = layout, edge.arrow.size=0.25)
Many thanks!


