Python's scipy spatial KD-tree is slower than brute force euclidean distances?
Asked Answered
B

2

5

I've quickly checked the performance of building a tree and querying it versus just calculating all the euclidean distances. If I query this tree for all other points within a radius, shouldn't it vastly outperform the brute force approach?

Does anyone know why my test code yields these different results? Am I using it wrong? Is the test case unfit for kd-trees?

PS: This is a reduced proof-of-concept version of the code I used. The full code where I also store and transform the results can be found here, but it yields the same results.

Imports

import numpy as np
from time import time
from scipy.spatial import KDTree as kd
from functools import reduce
import matplotlib.pyplot as plt

Implementations

def euclid(c, cs, r):
    return ((cs[:,0] - c[0]) ** 2 + (cs[:,1] - c[1]) ** 2 + (cs[:,2] - c[2]) ** 2) < r ** 2

def find_nn_naive(cells, radius):
    for i in range(len(cells)):
        cell = cells[i]
        cands = euclid(cell, cells, radius)

def find_nn_kd_seminaive(cells, radius):
    tree = kd(cells)
    for i in range(len(cells)):
        res = tree.query_ball_point(cells[i], radius)

def find_nn_kd_by_tree(cells, radius):
    tree = kd(cells)
    res =  tree.query_ball_tree(tree, radius)

Test setup

min_iter = 5000
max_iter = 10000
step_iter = 1000

rng = range(min_iter, max_iter, step_iter)
elapsed_naive = np.zeros(len(rng))
elapsed_kd_sn = np.zeros(len(rng))
elapsed_kd_tr = np.zeros(len(rng))

ei = 0
for i in rng:
    random_cells = np.random.rand(i, 3) * 400.
    t = time()
    r1 = find_nn_naive(random_cells, 50.)
    elapsed_naive[ei] = time() - t
    t = time()
    r2 = find_nn_kd_seminaive(random_cells, 50.)
    elapsed_kd_sn[ei] = time() - t
    t = time()
    r3 = find_nn_kd_by_tree(random_cells, 50.)
    elapsed_kd_tr[ei] = time() - t
    ei += 1

Plot

plt.plot(rng, elapsed_naive, label='naive')
plt.plot(rng, elapsed_kd_sn, label='semi kd')
plt.plot(rng, elapsed_kd_tr, label='full kd')
plt.legend()
plt.show(block=True)

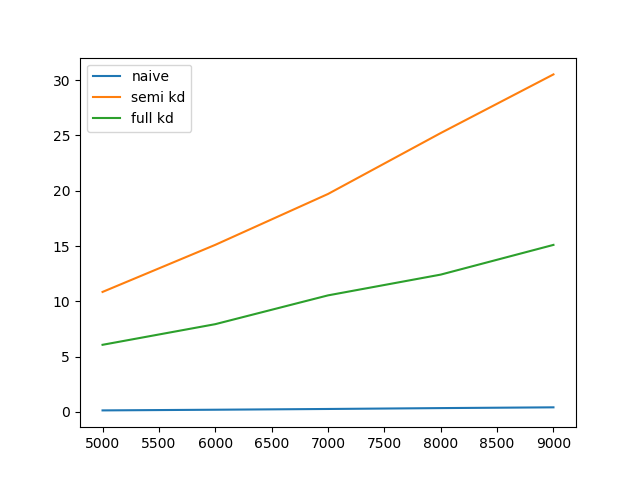
Plot results

Blais answered 19/9, 2019 at 11:44 Comment(6)
Spoiler alert: your naive implementations do not return anythingPneumatometer
I know, check the full code, there it does return stuff. I'm not using the return values either in this PoC. I'm just letting it calculateBlais
In my experience, scipy.spatial.cKDTree is substantially faster than the pure python implementation. cKDTree has exactly the same methods, etc, so you just need to change your import statement. Do your timing results hold in that case, too? Also, could you profile your functions to check whether most of the time is spent building the tree or querying it? The query times can often be improved by specifying a more suitable leafsize parameter.Densify
Wow ... The difference with cKDTree is amazing! The plot looks like this now: imgur.com/m5JXyGTBlais
@PaulBrodersen I'd accept your comment as a full answer. Could you also go into more detail about the effect of leafsize on the performance?Blais
It's complicated, and data set dependent, so the only way to find a good leaf size is by running tests on real data. When you run these tests on real data, make sure to time tree construction and querying separately, at least if you will re-use trees for multiple queries. This article from one of the authors of the sklearn implementation touches on the main points without getting too technical. Might be worth benchmarking the sklearn implementation as well.Densify
P
5

As documented in scipy.spatial.KDTree():

For large dimensions (20 is already large) do not expect this to run significantly faster than brute force. High-dimensional nearest-neighbor queries are a substantial open problem in computer science.

(this note is present in scipy.spatial.cKDTree() too, although that is probably a copy-paste documentation bug).

I took the liberty to rewrite your code with proper functions, so that I could run some automated benchmarks (based on this template). I have also included a brute-force Numba implementation:

import numpy as np
import scipy as sp
import numba as nb

import scipy.spatial

SCALE = 400.0
RADIUS = 50.0 


def find_nn_np(points, radius=RADIUS, p=2):
    n_points, n_dim = points.shape
    result = np.empty(n_points, dtype=object)
    for i in range(n_points):
        result[i] = np.where(np.sum(np.abs(points - points[i:i + 1, :]) ** p, axis=1) < radius ** p)[0].tolist()
    return result


def find_nn_kd_tree(points, radius=RADIUS):
    tree = sp.spatial.KDTree(points)
    return tree.query_ball_point(points, radius)


def find_nn_kd_tree_cy(points, radius=RADIUS):
    tree = sp.spatial.cKDTree(points)
    return tree.query_ball_point(points, radius)


@nb.jit
def neighbors_indexes_jit(radius, center, points, p=2):
    n_points, n_dim = points.shape
    k = 0
    res_arr = np.empty(n_points, dtype=nb.int64)
    for i in range(n_points):
        dist = 0.0
        for j in range(n_dim):
            dist += abs(points[i, j] - center[j]) ** p
        if dist < radius ** p:
            res_arr[k] = i
            k += 1
    return res_arr[:k]


@nb.jit(forceobj=True, parallel=True)
def find_nn_jit(points, radius=RADIUS):
    n_points, n_dim = points.shape
    result = np.empty(n_points, dtype=object)
    for i in nb.prange(n_points):
        result[i] = neighbors_indexes_jit(radius, points[i], points, 2)
    return result

These are the benchmarks I got (I have omitted scipy.spatial.KDTree() because it was way off chart, consistently with your findings):

mb_full


(for completeness, following is the code required to adapt the template)

def gen_input(n, dim=2, scale=SCALE):
    return scale * np.random.rand(n, dim)


def equal_output(a, b):
    return all(sorted(a_i) == sorted(b_i) for a_i, b_i in zip(a, b))


funcs = find_nn_np, find_nn_jit, find_nn_kd_tree_cy


input_sizes = tuple(int(2 ** (2 + (1 * i) / 4)) for i in range(32, 32 + 16 + 1))
print('Input Sizes:\n', input_sizes, '\n')


runtimes, input_sizes, labels, results = benchmark(
    funcs, gen_input=gen_input, equal_output=equal_output,
    input_sizes=input_sizes)


plot_benchmarks(runtimes, input_sizes, labels, units='s')
Pneumatometer answered 19/9, 2019 at 17:11 Comment(5)
3 dimensions isn't considered "high-dimensional" though and it performed worse than something with an expected runtime of O(n²) while it should perform O(nlogn).Blais
Note that your observation on asymptotic complexity only means that for large enough n any given KD-tree implementation will be faster than brute force. For scipy.spatial.KDtree(), that n may well be beyond what your memory could fit.Pneumatometer
Still I think a "yo bois, waddup" is warranted for such a poor implementation of such a high profile package.Blais
Perhaps you should raise the issue on their repository. I would agree that with those numbers scipy.spatial.KDtree() is mostly useless.Pneumatometer
@RobinDeSchepper Note that there are some profiling / timings here for this: ibm.com/developerworks/community/blogs/jfp/entry/…Pneumatometer
B
5

TL;DR:

Switch to scipy.spatial.cKDTree or sklearn.neighbors.KDTree for performances as expected from kd-tree algorithms.

Blais answered 19/9, 2019 at 18:33 Comment(0)

© 2022 - 2024 — McMap. All rights reserved.