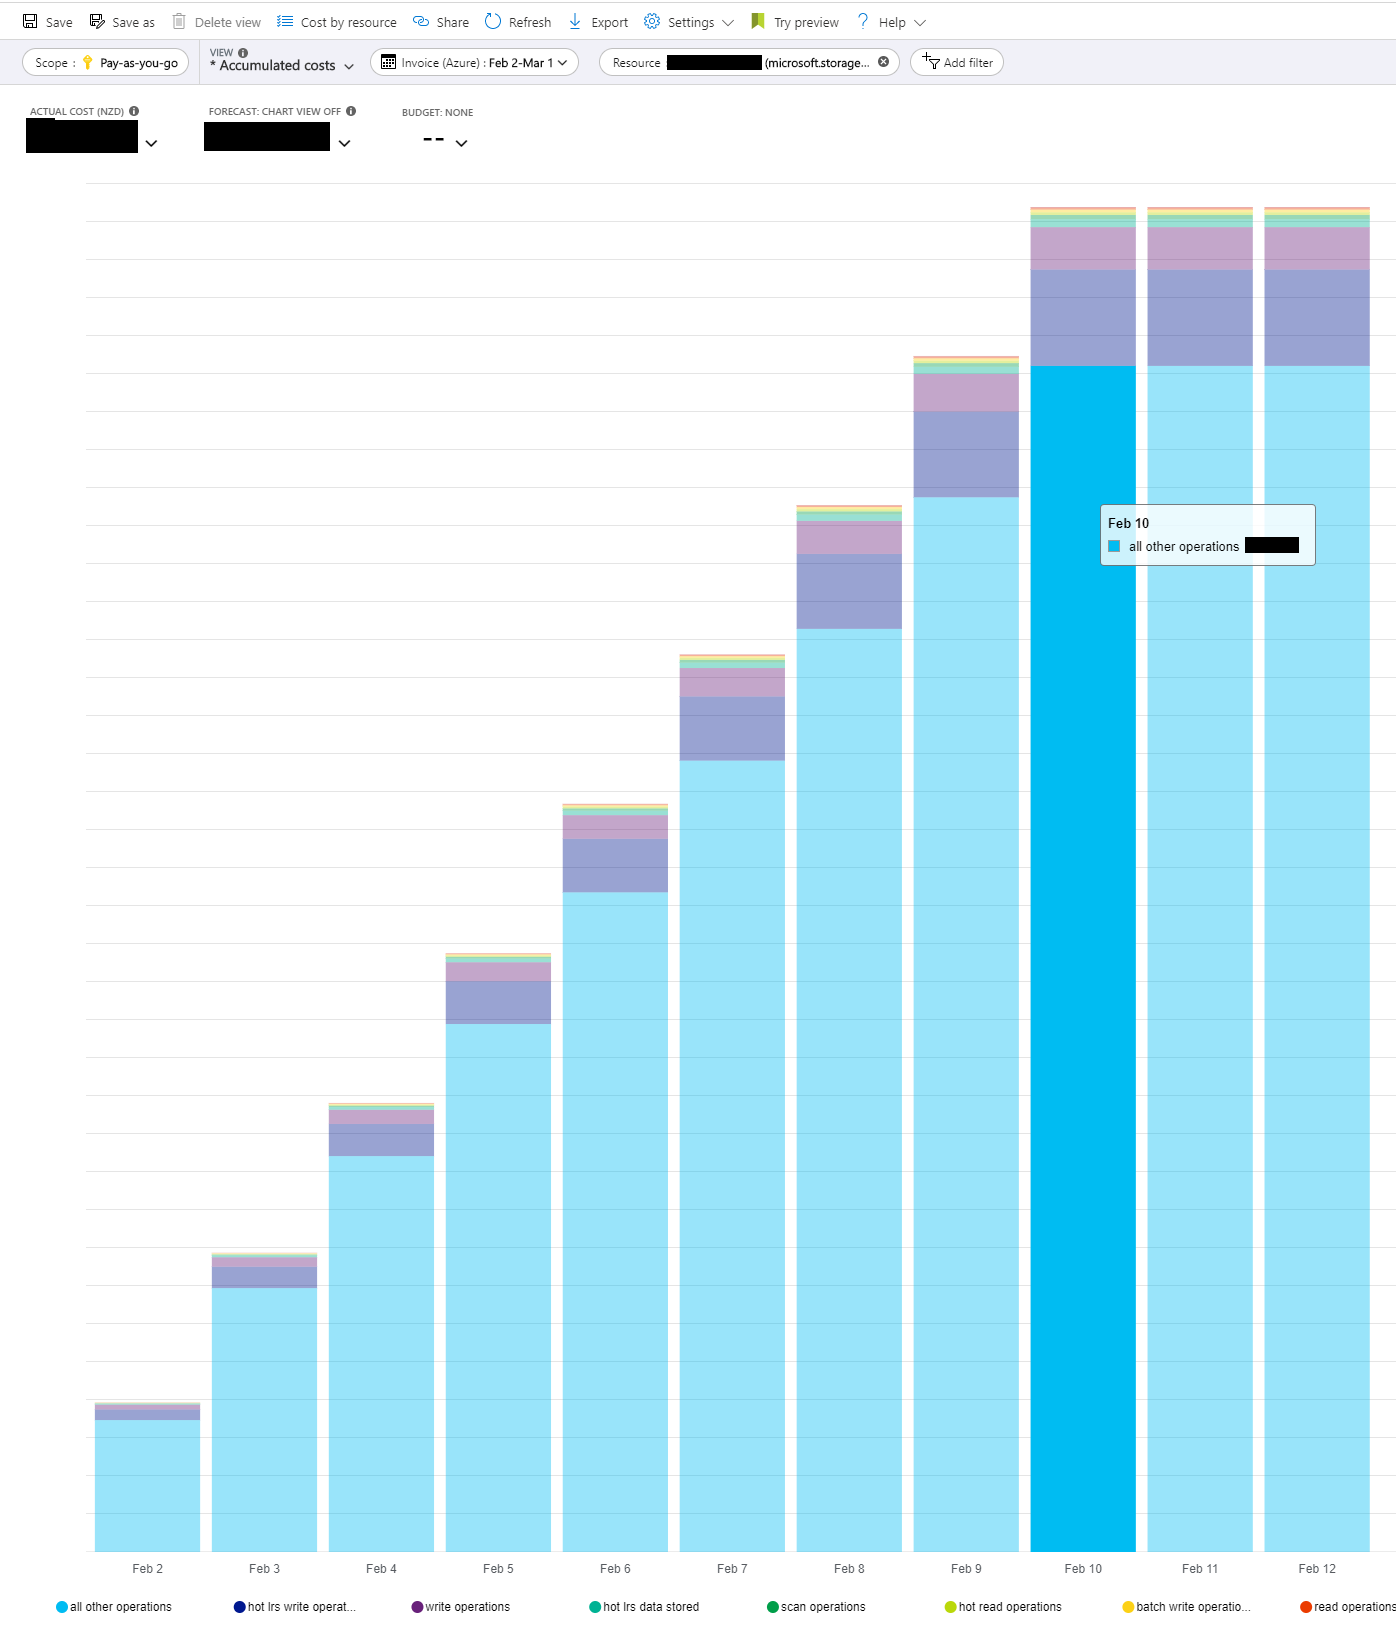
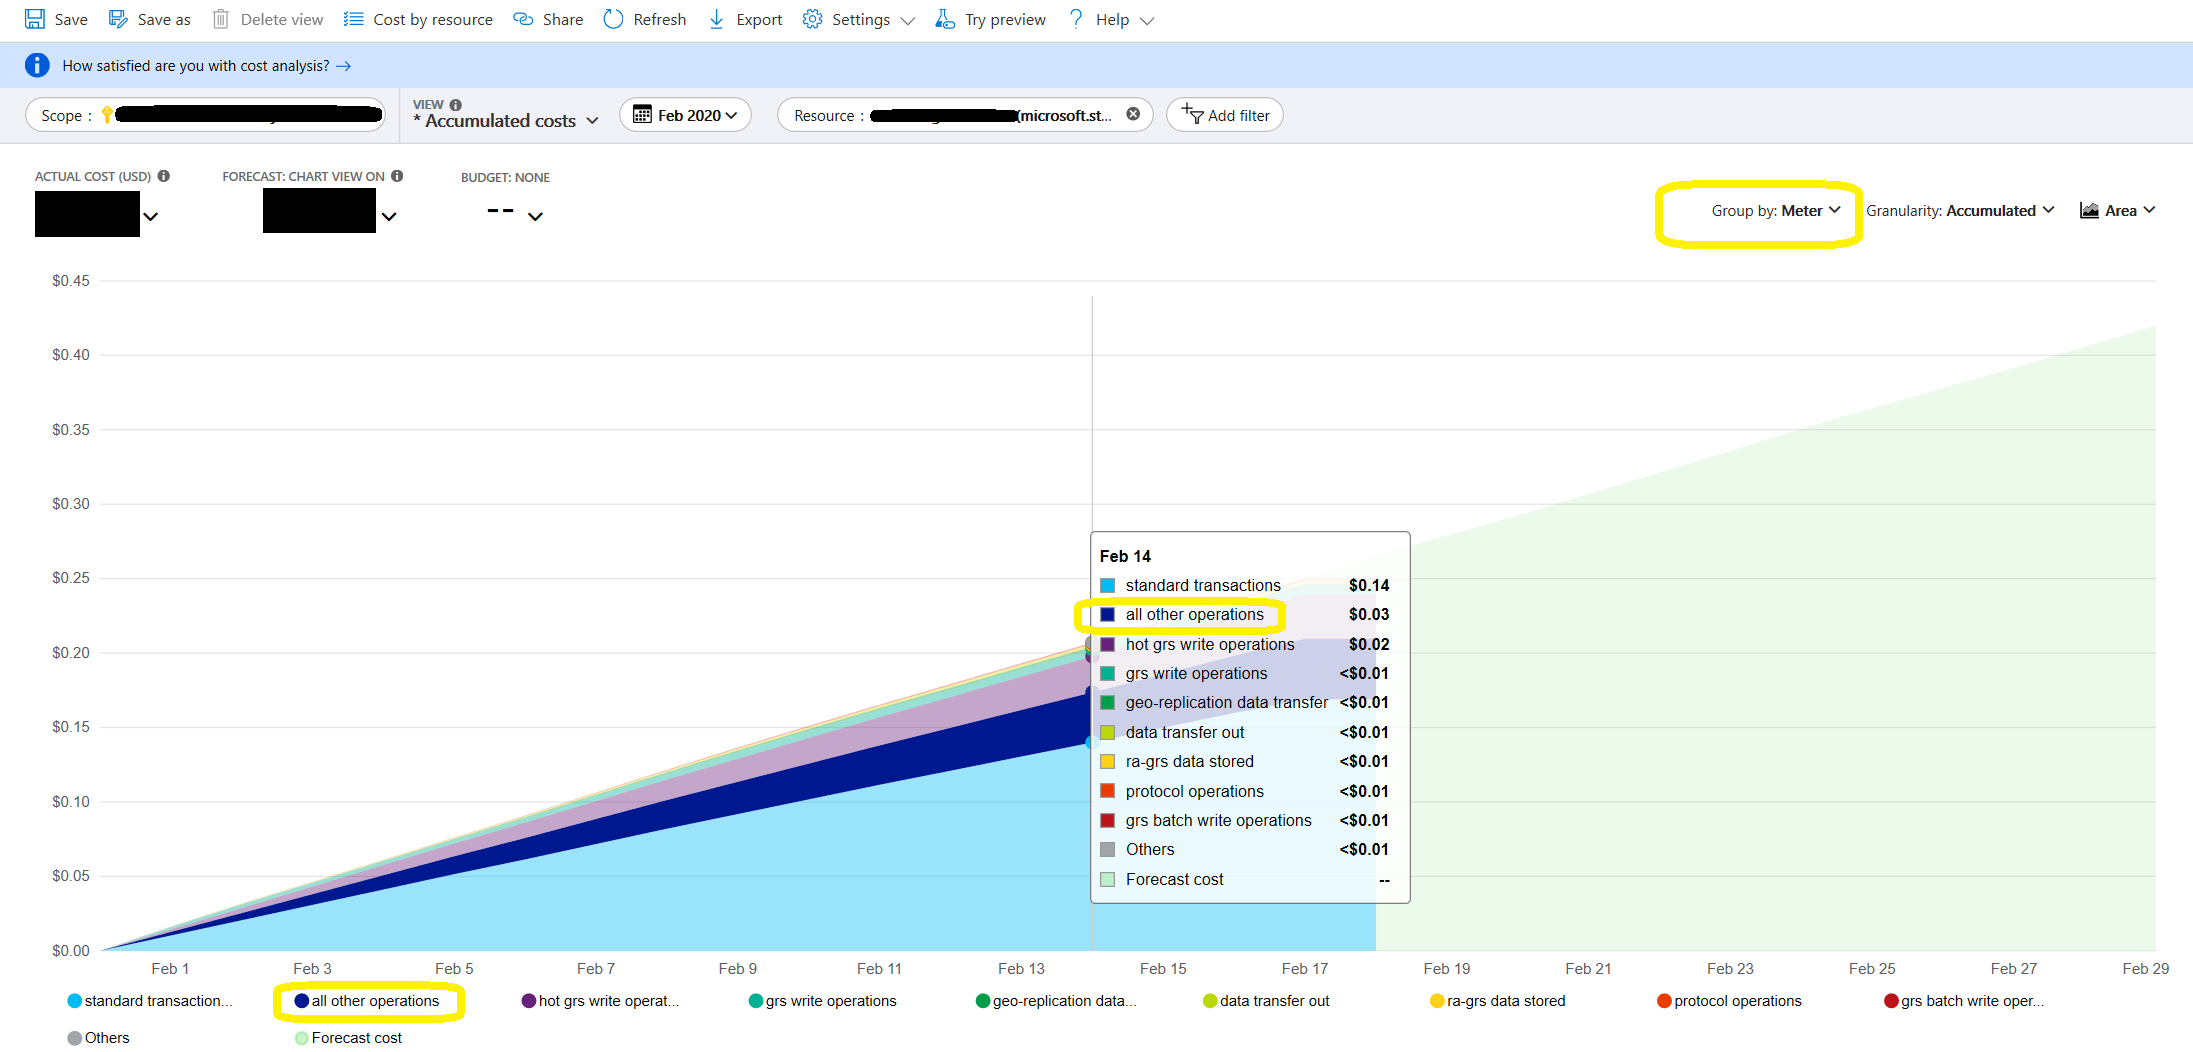
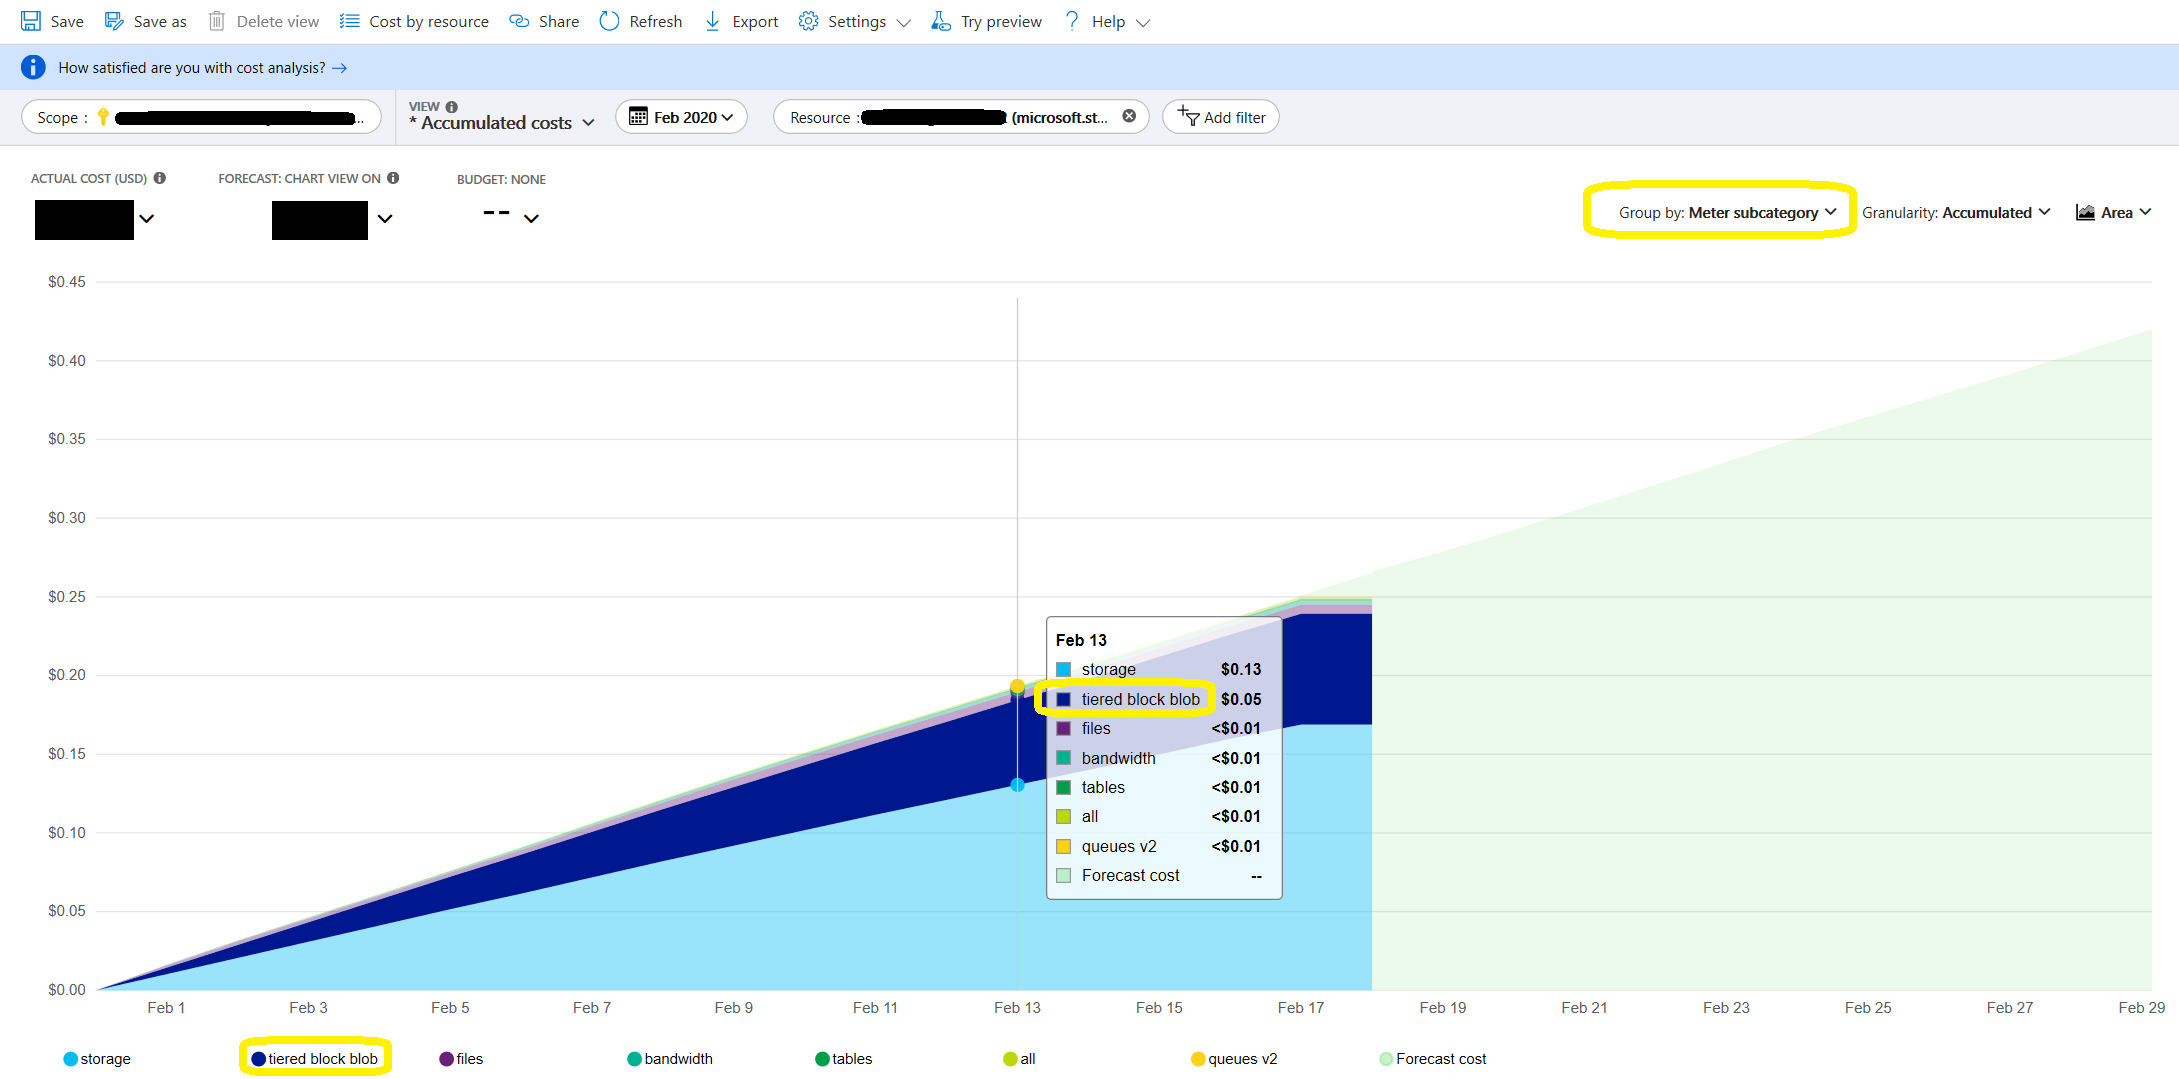
After a support call with Azure, they pointed me to some of the (somewhat hidden) tracing capabilities.
First and easiest is to check the type of transactions.
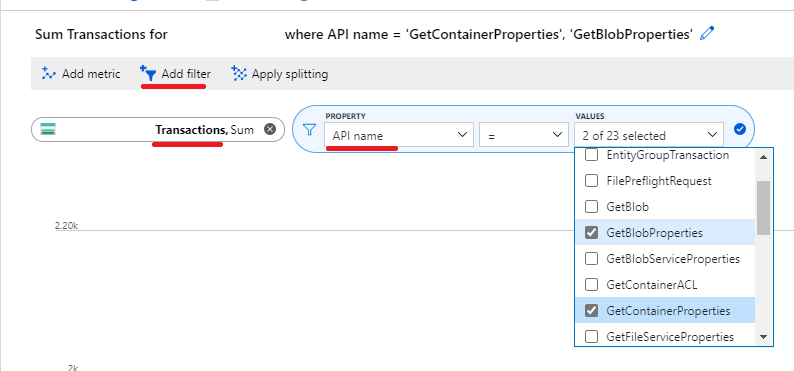
- Go to the storage account > Metrics
- Select
Transactions as the metric
- Click
Add Filter and select API Name as the property
- Select the API names you think are the suspects
![Azure storage transaction metrics]()
Unfortunately selecting multiple doesn't show them separately, so you have to try every API individually and see if anything sticks out.
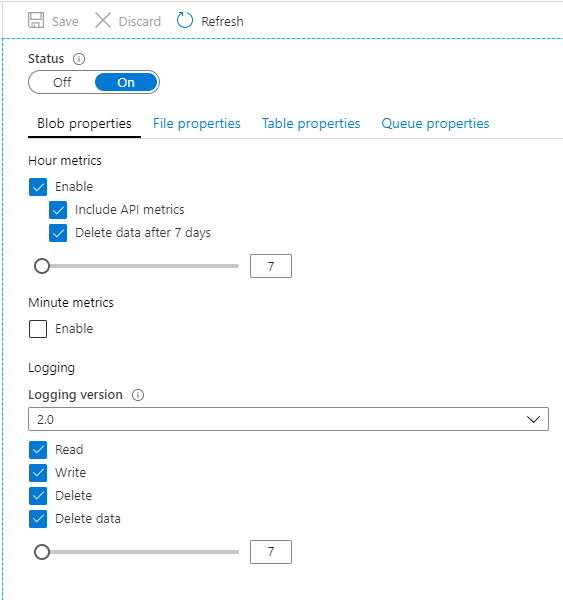
Second option is to enable Diagnostics Logging for the storage type you're interested in.
If the above doesn't yield any good results, or you're curious about the exact calls at exact times .etc. you can enable this feature, and wait for logs to be collected, usually over a few days, so you have a good sample set to reason.
- Go to the storage account >
Diagnostic settings (classic).
- This is under
Monitoring (classic) doesn't seem to have a replacement in the new Monitoring section.
- Enable logging and metrics type (hour or minute)
- Click
Save
![azure storage diagnostic logs setup]()
These logs are written to a blob storage in the same account to a container named $logs. According to docs, this container cannot be deleted after enabling, but the content can be deleted when you're done.
Note that if your storage account gets a lot of traffic, this log can get very big very quick. You're charged the same rates for reads, writes and storage in this container as usual, including the log writes the platform does when these settings are enabled.
See documentation here
After setting this up, give it some time to collect data.
Use storage explorer or other means to navigate and download the logs and inspect them.
Logs contain every request made to storage, with details such as timestamp, API name, result, whether the operation was authenticated, and if you're looking at blobs it also shows the url, the user agent and more.
(turns out my app did close to 100,000 calls to GetBlobProperties and GetContainerProperties per day🎈)

