How to stop ngx-chart from adding decimal to x axis
Asked Answered
P

2

5

I have created a chart using ngx-chart. The x-axis should populate year. My array of year currently has values: 2020, 2021,2022,2023. However when it is displayed in the chart, it automatically adds 2020.5, 2021.5, ...

The value has to be number in order to sort the year in ascending order. Is there a way to prevent the decimal from being autogenerated?

Typescript:

   setChartValue(items: any[]): void {
    let chartValues = [];

    items.forEach((item) => {
             chartValues.push({
                'name': moment(item.purchaseDate, "DD/MM/YYYY").year(),
                'value': item.purchasePrice
             });
    })

    this.multi = [
        {
            'name': 'Purchase Summary',
            'series': chartValues
        }
    ];
}

Html:

<ngx-charts-line-chart [view]="view"
[scheme]="colorScheme"
 [results]="multi"
 [gradient]="gradient"
 [xAxis]="showXAxis"
 [yAxis]="showYAxis"
 [legend]="showLegend"
 [showXAxisLabel]="showXAxisLabel"
 [showYAxisLabel]="showYAxisLabel"
 [xAxisLabel]="xAxisLabel"
 [yAxisLabel]="yAxisLabel"
 [autoScale]="autoScale"
 [timeline]="timeline">
 </ngx-charts-line-chart>
Pursuit answered 28/5, 2020 at 12:45 Comment(1)
I have the same problem, Looks like the graph in order to fill the width of the graph, it will generate decimal places to cover the gaps. Did you find any solution for this problem? please post it if so.Baud
R
5

I have a similar situation on the y axis that might help. In the html for the chart I added [yAxisTickFormatting]="yAxisTickFormattingFn"

In the class definition I added: public yAxisTickFormattingFn = this.yAxisTickFormatting.bind(this);

yAxisTickFormatting(value) {
    return value;
}

I don't know why this would change anything, but it removed the '.0' for the y axis values.

Rebeca answered 17/12, 2020 at 21:7 Comment(2)
I think you have another logic around there, I did the same without results. Also by implementing something different in the return value; like "return Number.parseInt" will not do the trick, because it will return 1, 1, 1, 1 which is not acceptable also. Still no clue how to solve this.Baud
Here Math.trunc can be used explicitly to return the value: yAxisTickFormatting(value: number): number { return Math.trunc(value); }Parabolize
B
5

Ok, I have an answer, not sure if it's possible to configure ngx-chart to prevent decimals to fill the gaps, but I found an "elegant" solution by using this formula.

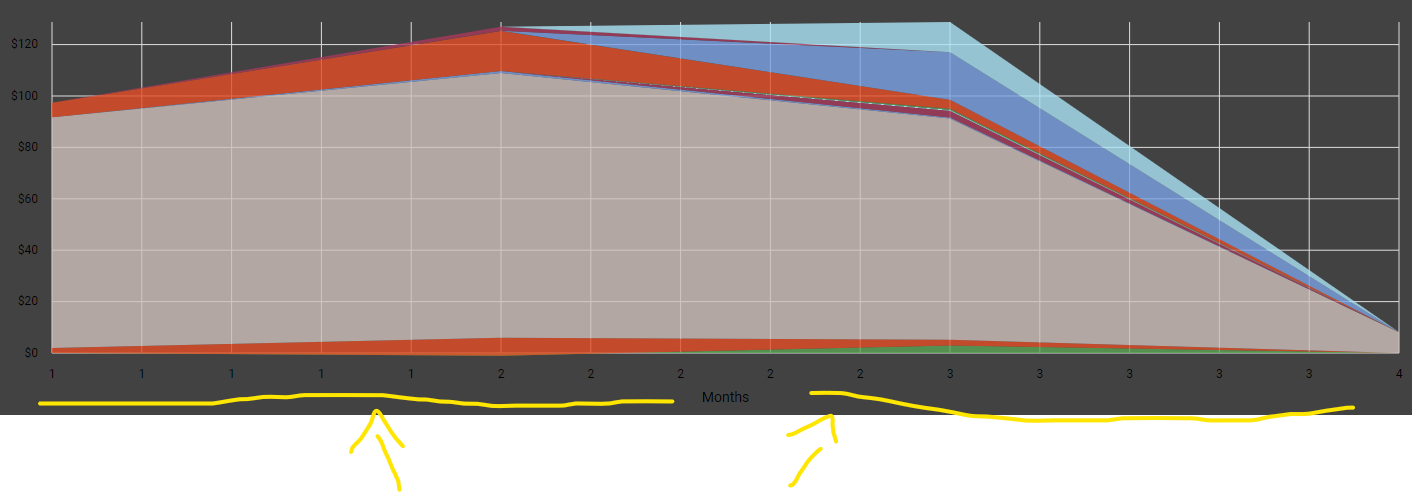
As you see I have the same problem here but with Months, I have just 4 months, but the xAxis is repeating them 5 times to fill the graph and cover the width. enter image description here

Solution: Add this to your HTML attributes for the ngx-chart

[xAxisTickFormatting]="xAxisFormat"

then your method in the TS file should look like this:

  xAxisFormat(val : any) {
     if (val % 1 > 0) return "";
     return val ;
  }

Result working, not showing repeated values anymore:

enter image description here

The reasson why this works, the following line will return EMPTY to the graph, if the val has a decimal value, if the number is an integer, it will be returned properly, and this will look like the value was not repeated.

if (val % 1 > 0) return "";

Hope it helps.

Baud answered 3/4, 2022 at 4:23 Comment(0)

© 2022 - 2024 — McMap. All rights reserved.