Yes! You can do this with JavaScript, as well as add event listeners and do other DOM manipulation similar to with a normal HTML page. (See the bottom of this answer for how to draw a line on the SVG given two points.)
I am working on a project that does exactly this. The user is able to enter their starting room number and destination room number, and the route is plotted on the SVG.
![Route on SVG]()
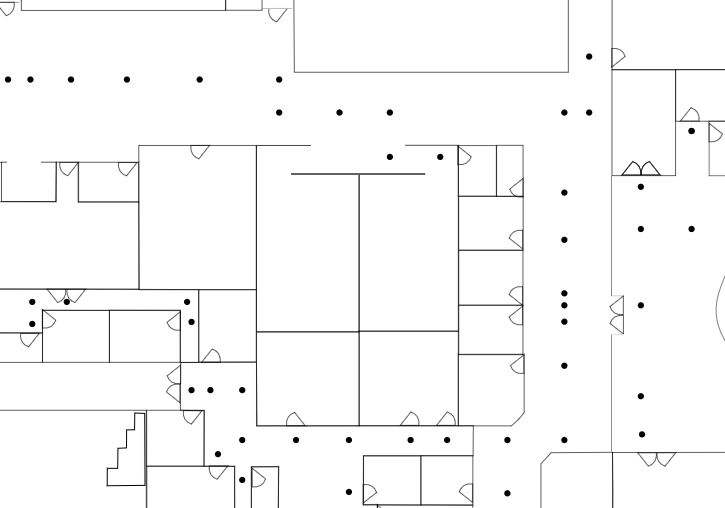
It was a bit tedious, but what we did was put circle elements on the SVG. There were elements outside of each doorway, and also at hallway intersections.
A typical element is as follows.
    <circle
        id="route3287-1"
        style="fill:#000000;stroke:none"
        cx="2014.0000"
        cy="239.6"
        r=".05"
        data-neighbors="route3296-1,06-07" />
Note that the radius attribute is small enough to where it won't be seen on the SVG (unless the user decides to zoom in alot). We also manually entered into the data-neighbors attribute the ids of adjacent points. This is because our back end parses the SVG file, builds a graph using these points, and uses Dijkstra's algorithm to generate the route. We used the cx and cy attributes to calculate the distance between nodes on the graph.
Here is a close up of what the points look like (when the radius is big enough to see them)
![Navigation points]()
Now, when a route is generated we are simply drawing lines on the SVG between each of the points. We put each of the lines in a group so that we can reference it by id later and remove the entire route when we decide to draw a new one.
Here is an example. Where "svg" is a reference to the SVG element, here is how we draw a line between two points (x1,y1,x2,y2), you could easily iterate through a list of points and draw all the lines in a similar fashion.
    var newElement = svg.createElementNS('http://www.w3.org/2000/svg', 'path');
     newElement.setAttribute('d', 'M' + x1 + ',' + y1 + 'L' + x2 + ',' + y2);
     newElement.style.stroke = '#000000';
     newElement.style.strokeWidth = '15px';
     svg.appendChild(newElement);


