I'm trying to plot a graph using dataframes.
I'm using 'pandas_datareader' to get the data.
so my code is below:
tickers = ["AAPL","GOOG","MSFT","XOM","BRK-A","FB","JNJ","GE","AMZN","WFC"]
import pandas_datareader.data as web
import datetime as dt
end = dt.datetime.now().strftime("%Y-%m-%d")
start = (dt.datetime.now()-dt.timedelta(days=365*3)).strftime("%Y-%m-%d")
%matplotlib inline
import matplotlib.pyplot as plt
import pandas as pd
data = []
for ticker in tickers:
    sub_df = web.get_data_yahoo(ticker, start, end)
    sub_df["name"] = ticker
    data.append(sub_df)
data = pd.concat(data)
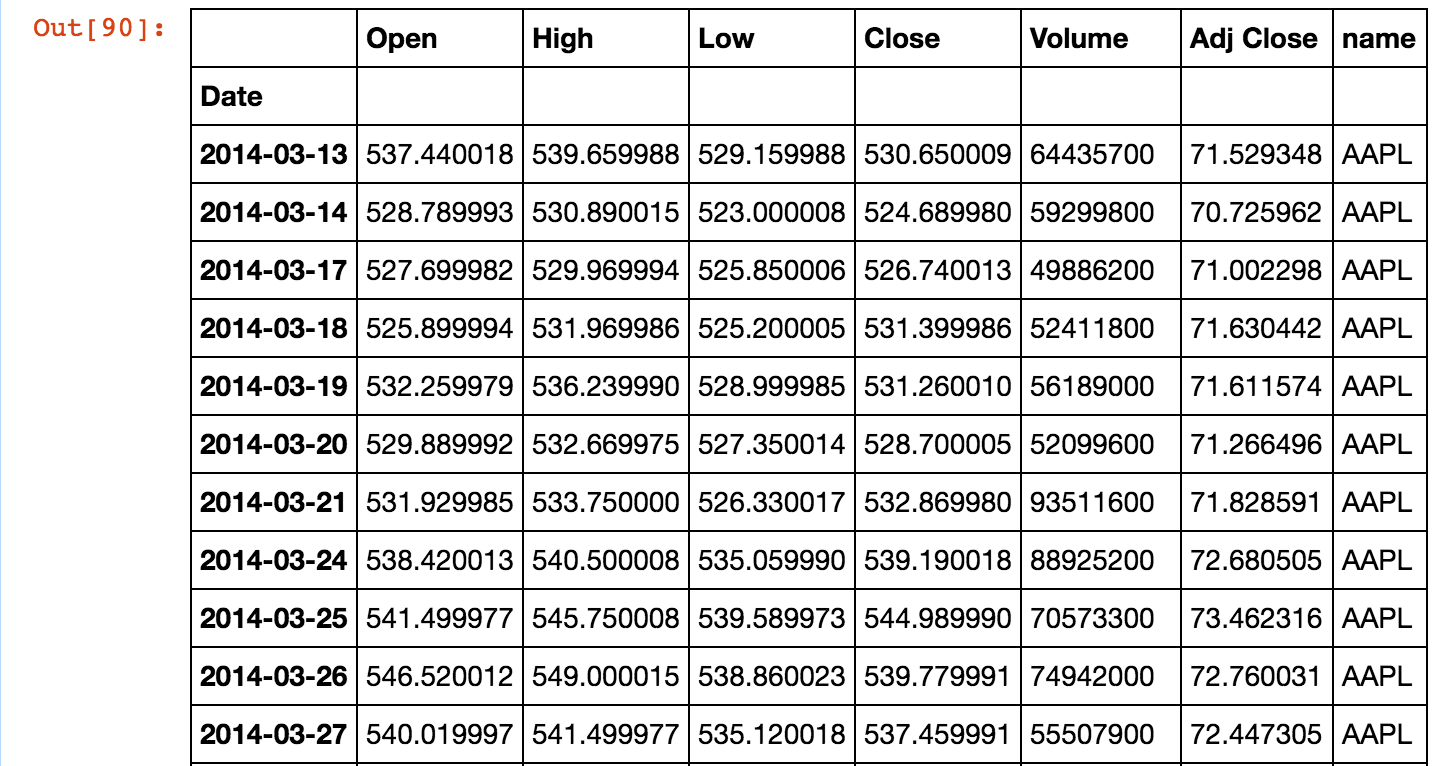
So in the variable data, there are 8 columns = ['Date', 'Open', 'High' ,'Low' ,'Close' 'Volume', 'Adj Close','name']
The variable 'data' is shown below:

What I want to do is to plot a graph taking 'date' values as x-parameter , 'high' as y-parameter with multiple columns as 'name' column values(=["AAPL","GOOG","MSFT","XOM","BRK-A","FB","JNJ","GE","AMZN","WFC"]).
How can I do this?
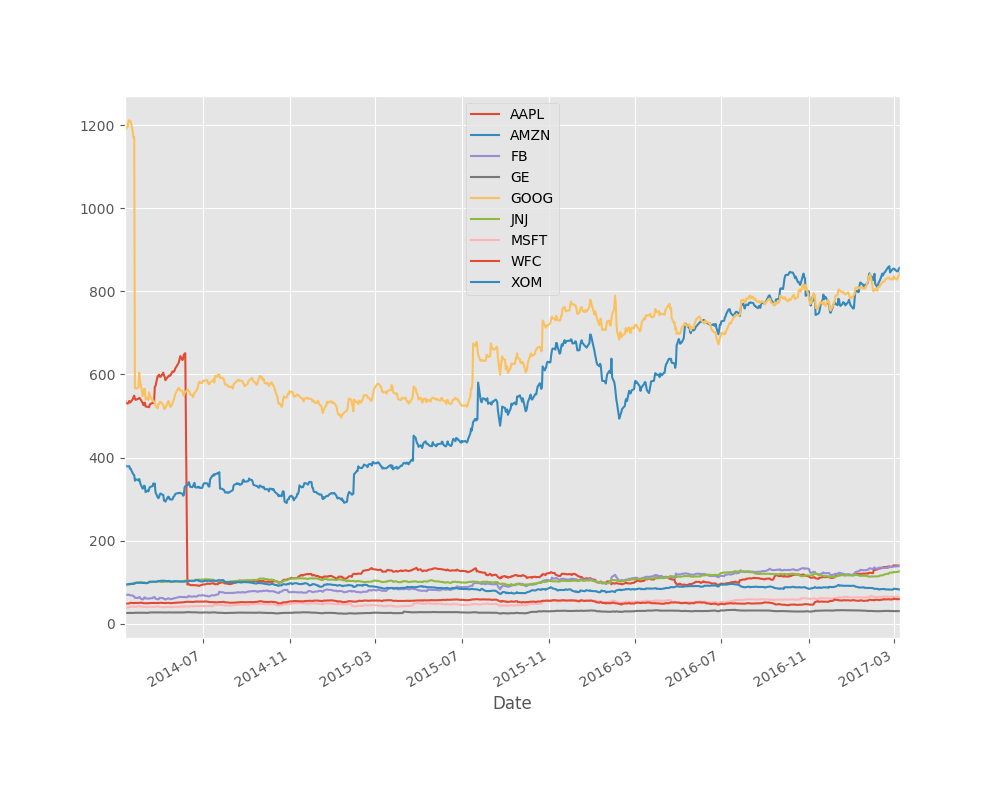
When i executed data.plot(), the result takes data as x-parameter well but there are 5 columns ['open','high','low','close','volume','adj close'] not 7 columns ["AAPL","GOOG","MSFT","XOM","BRK-A","FB","JNJ","GE","AMZN","WFC"] : what i want to do.
The result is below:


sub_df). Each of them hasDateandHigh, so just plot each of them in a loop:sub_df.plot(x='Date',y='High',label=ticker). They will be all displayed in the same chart. You may want to add a legend to see which one is which (plt.legend()). – DeterminantDateis actually an index. Then you needsub_df.reset_index().plot(...). – Determinant