How do I extract random effects from MCMCglmm?
Asked Answered
F

2

5

I am looking for a command similar to ranef() used in nlme, lme4, and brms that will allow me to extract the individual random effects in my MCMCglmm model. In my dataset, I have 40 providers and I would like to extract the random effects for each provider and plot them in a caterpillar plot. Any suggestions would be great. Thank you.

In case it is helpful, here is my MCMCglmm model:

prior.3 <- list(R = list(R1 = list(V = diag(2), nu = 0.002)), 
                G = list(G1 = list(V = diag(2), nu = 0.002), 
                         G2 = list(V = diag(2), nu = 0.002))) 

mc_mod2 <- MCMCglmm(outcome ~ 1, data = filter(data, rem2 == "white" | rem2 == "rem"),
                  random = ~ idh(rem2):id + us(rem2):provider,
                  rcov = ~idh(rem2):units,
                  verbose = TRUE,
                  prior = prior.3,
                  family = "gaussian",
                  nitt = 100000, burnin = 5000,
                  pr = TRUE)
Frodeen answered 1/12, 2017 at 17:4 Comment(4)
rdrr.io/github/JWiley/postMCMCglmm/man/ranef.MCMCglmm.html ?Megmega
I tried that using ranef(mc_mod2) and I am thrown the following error: Error in UseMethod("ranef") : no applicable method for 'ranef' applied to an object of class "MCMCglmm"Frodeen
did you install that package and load it?Megmega
blast... i overlooked the package name on that site and assumed it was mcmcglmm. many thanks, ben.Frodeen
M
11

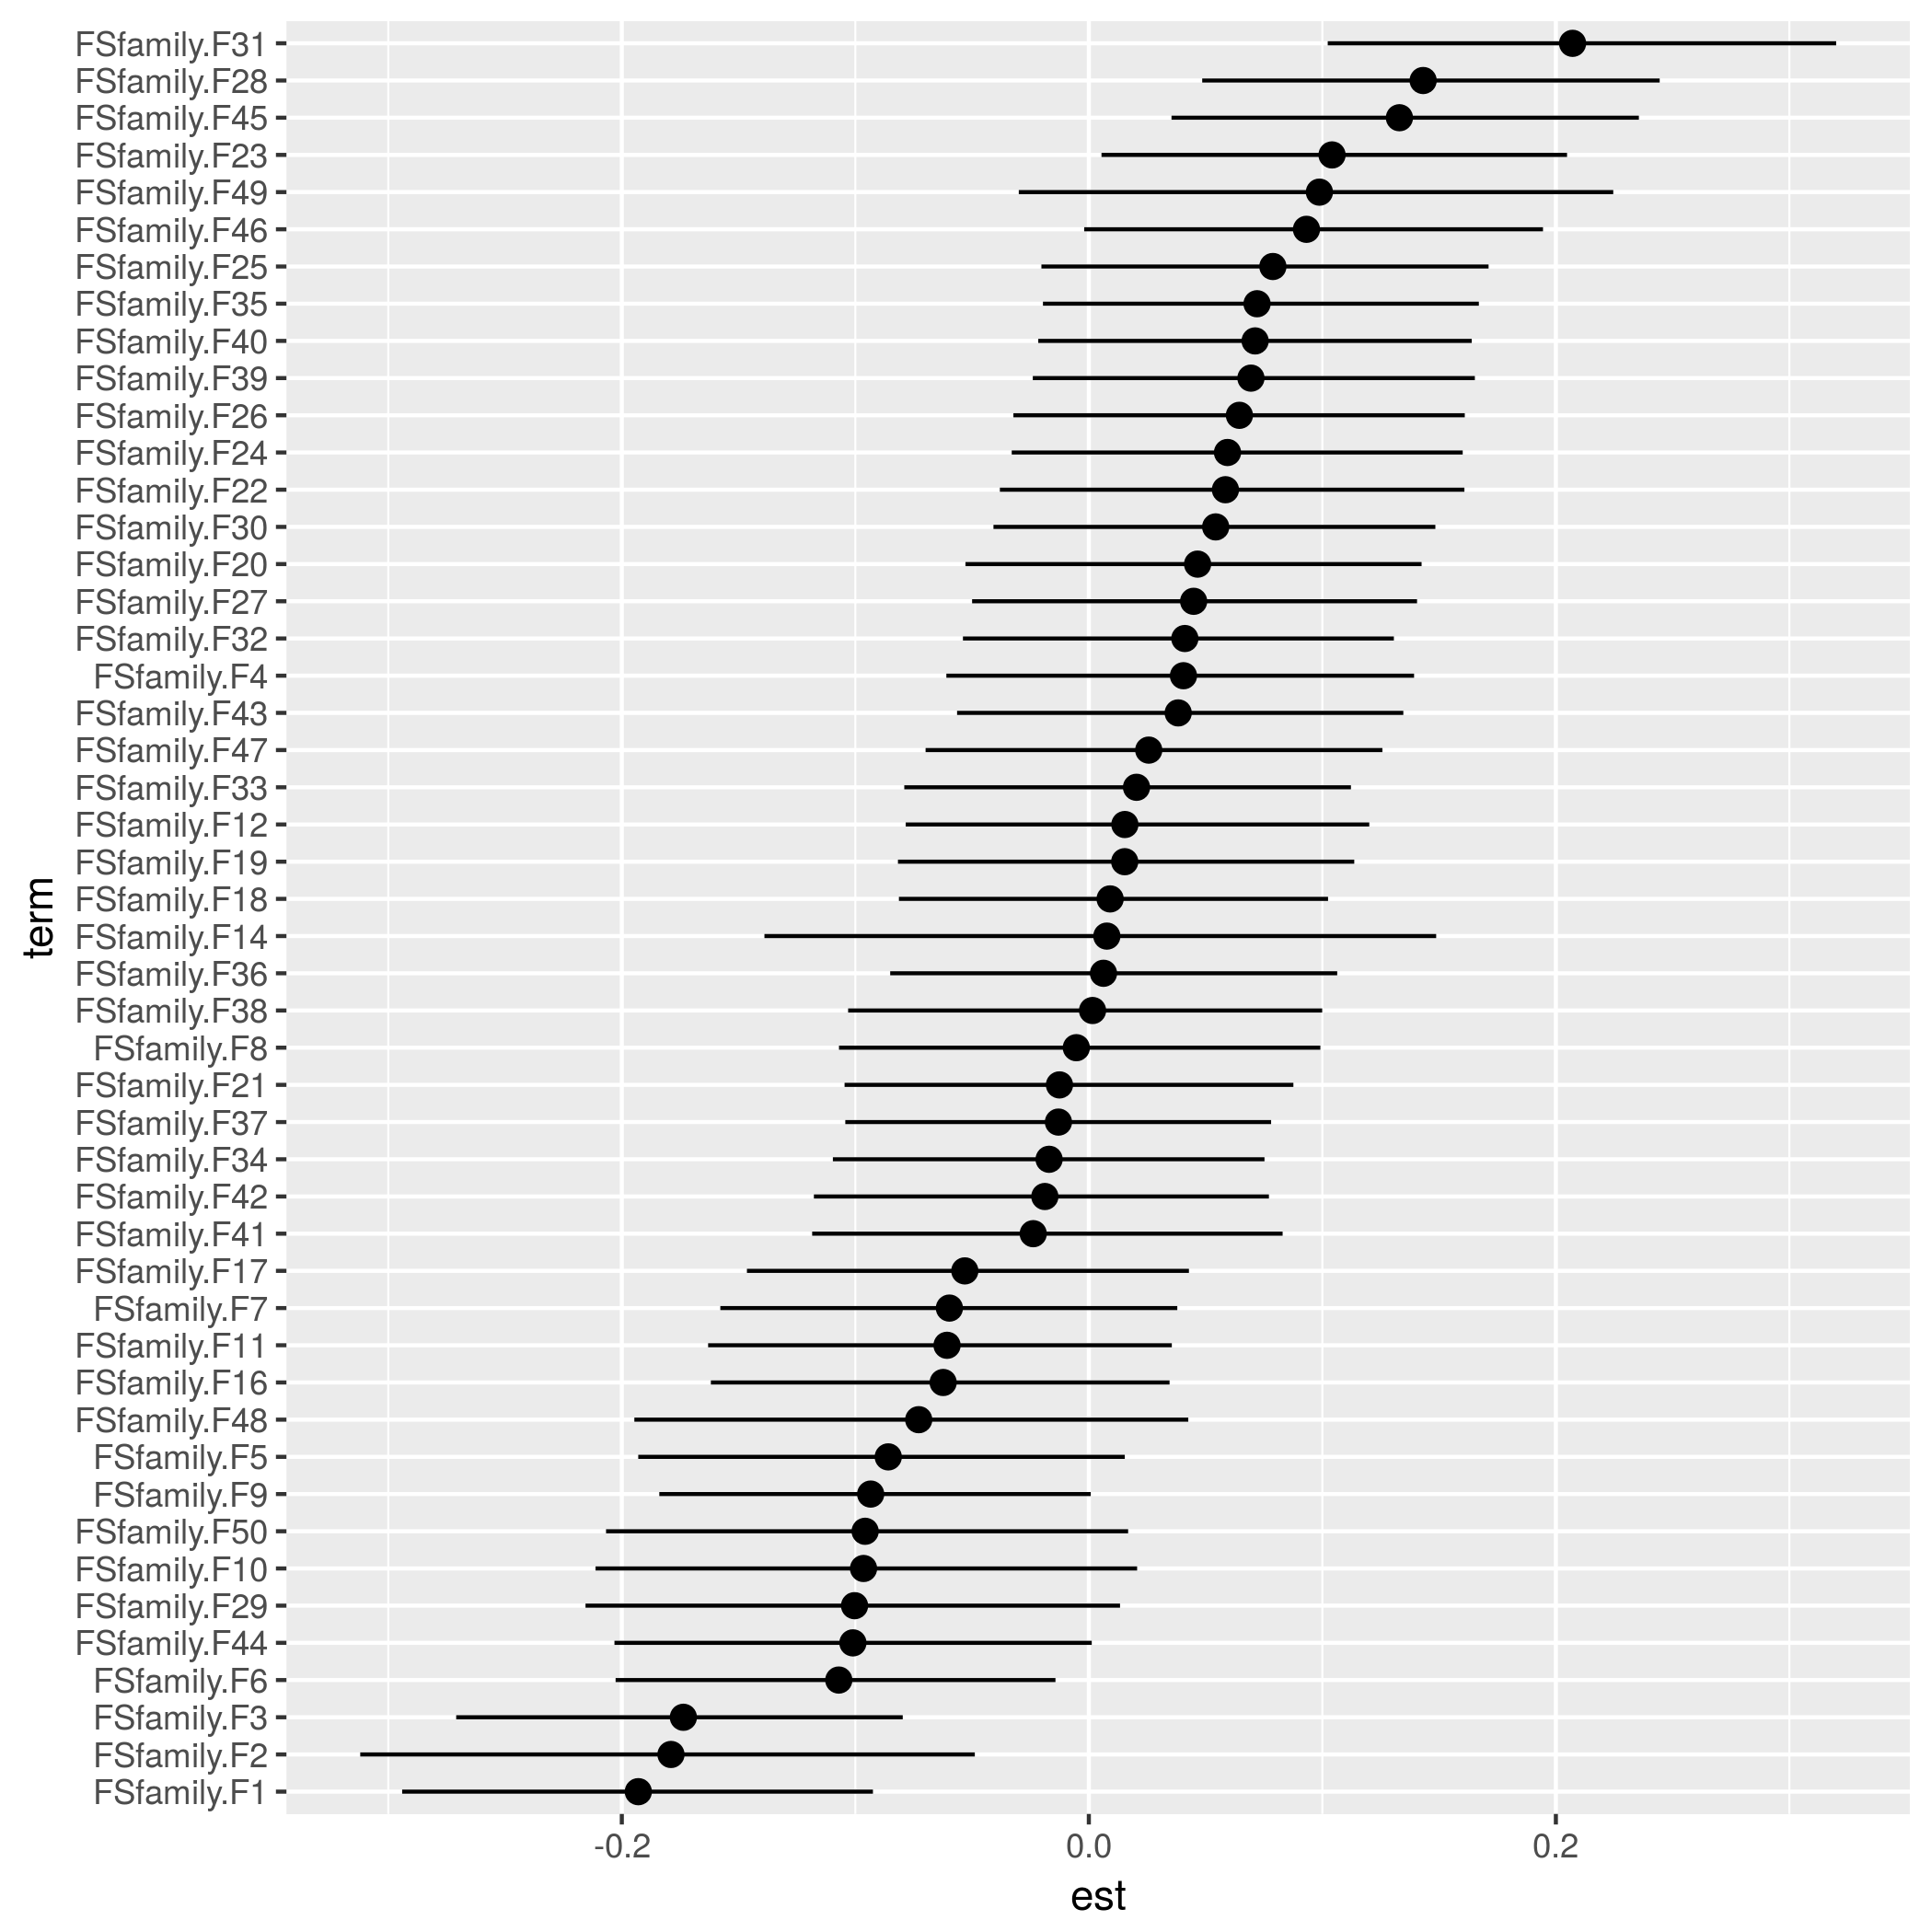
A little more detail, since the package doesn't seem to have caterpillar plots built in: note you need to use pr=TRUE when calling MCMCglmm in order to store the random effects values.

library(MCMCglmm)
data(PlodiaPO)  
model1 <- MCMCglmm(PO~1, random=~FSfamily, data=PlodiaPO, verbose=FALSE,
                 nitt=1300, burnin=300, thin=1,
                 pr=TRUE)
if (!require("postMCMCglmm")) {
    devtools::install_github("JWiley/postMCMCglmm")
    library("postMCMCglmm")
}

ranef() appears to return a matrix of the random effects (rows=levels, columns=samples). Convert to a data frame with mean and quantiles:

qfun <- function(x,lev) unname(quantile(x,lev))
rsum <- as.data.frame(t(apply(ranef(model1),1,
      function(x) c(est=mean(x),
                    min=qfun(x,0.025),max=qfun(x,0.975)))))

Order for plotting:

rsum$term <- reorder(factor(rownames(rsum)),
                     rsum$est)

Plot:

library(ggplot2)
ggplot(rsum,aes(term,est))+
    geom_pointrange(aes(ymin=min,ymax=max))+
    coord_flip()

enter image description here

Megmega answered 1/12, 2017 at 17:24 Comment(3)
This is fantastic... Thank you, Ben. My only issue is that the ranef function does not seem to work when I specify my random effects as so: random = ~ idh(rem2):id + us(rem2):provider ... my intention is to extract random effects at the client and provider status based on client's racial-ethnic minority status (white/non-white). When I call only id and provider random effects, the ranef function works great, but when I stratify them based on REM status, the ranef function outputs an empty matrix. Any ideas?Frodeen
Ultimately, the goal is to have a random effect output that looks similar to: provider_1_white, provider_1_rem, provider_2_white, provider_2_rem, etc. Maybe this isn't possible?Frodeen
I found a solution... when random effects are stratified (as shown in my model above) the ranef() function in postMCMCglmm will not work (at least as of this writing). but they can be extracted manually by using str(mc_mod2) and then put in a readable format using cbind(B = posterior.mode(mc_mod2$Sol[,1:50]), CI = HPDinterval(mc_mod2$Sol[,1:50]))Frodeen
F
0

I overlooked an additional package that needed to be installed (thanks for pointing this out, Ben).

To be able to run ranef(), simply install the postMCMCglmm package - https://github.com/jwiley/postMCMCglmm/

#install.packages("devtools")
require(devtools)

install_github("JWiley/postMCMCglmm")
Frodeen answered 1/12, 2017 at 17:19 Comment(0)

© 2022 - 2024 — McMap. All rights reserved.