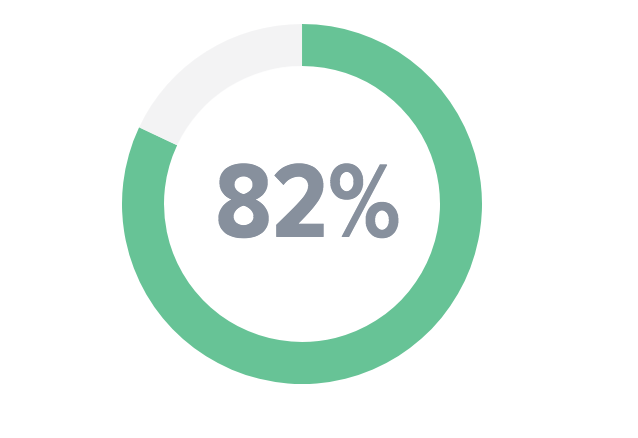
I have this donut chart currently working in an AngularJS app:
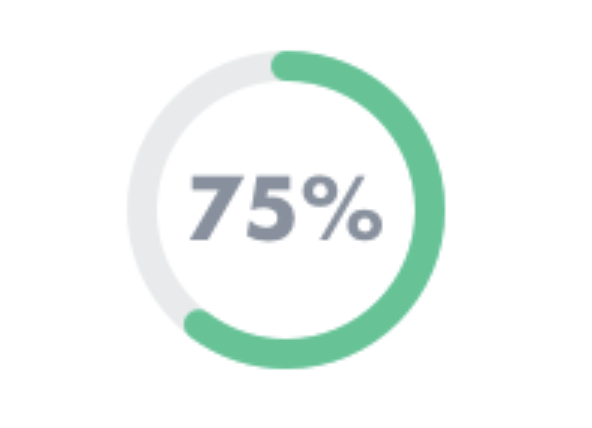
But the design mockup says we would like this, note the border-radius property on the green portion of the arc:
How do I add a border-radius to the SVG that d3js outputs, the code I'm currently using looks like this:
let data = [
    {
        label: 'Data',
        count: scope.data
    },
    {
        label: 'Fill',
        count: 100 - scope.data
    }
];

let width = 60;
let height = 60;
let radius = Math.min(width, height) / 2;
let color = d3.scale
    .ordinal()
    .range(['#3CC692', '#F3F3F4']);
let selector = '#donut-asset-' + scope.chartId;

d3
    .select(selector)
    .selectAll('*')
    .remove();

let svg = d3
    .selectAll(selector)
    .append('svg')
    .attr('width', width)
    .attr('height', height)
    .append('g')
    .attr(
        'transform',
        'translate(' + width / 2 + ',' + height / 2 + ')'
    );
let arc = d3.svg
    .arc()
    .innerRadius(23)
    .outerRadius(radius);
let pie = d3.layout
    .pie()
    .value(function(d) {
        return d.count;
    })
    .sort(null);
let path = svg
    .selectAll('path')
    .data(pie(data))
    .enter()
    .append('path')
    .attr('d', arc)
    .attr('fill', function(d, i) {
        return color(d.data.label);
    });
let legend = svg
    .selectAll('.legend')
    .data(data)
    .enter()
    .append('g')
    .attr('class', 'legend')
    .attr('transform', function(d, i) {
        return 'translate(' + 0 + ',' + 0 + ')';
    });
legend
    .append('text')
    .attr('x', 1)
    .attr('y', 1)
    .attr('text-anchor', 'middle')
    .attr('dominant-baseline', 'central')
    .text(function(d) {
        return d.count + '%';
    });
};
I know to use cornerRadius but when I do it sets a radius for both arcs, it just needs to exist on the colored one. Any ideas? Thanks in advance for any help!


