Thanks, guys. I just finished writing my own codes to do interpolation. But my idea is from yours. Thank you to @asaflotz and @Paul Panzer.
The thing is in my scenario, points in point cloud are not arranged well. The intervals between two nearby points are not uniform. It's impossible to use grid directly. So I picked up an unstructured method in Scipy.Interpolate which has so many practical methods can be used depending on different use case. My code below is a modified version of the example from Scipy.Interpolate.griddata.
x_range=((df.X.max()-df.X.min()))
y_range=((df.Y.max()-df.Y.min()))
grid_x, grid_y = np.mgrid[df.X.min():df.X.max():(x_range*1j), df.Y.min():df.Y.max():(y_range*1j)]
points = df[['X','Y']].values
values = df['new'].values
grid_z0 = griddata(points, values, (grid_x, grid_y), method='linear').astype(np.uint8)
im=Image.fromarray(grid_z0,'L')
im.show()
Noticed that in griddata, methods like 'linear', 'nearest', 'cubic' can be applied depending on your scenarios.
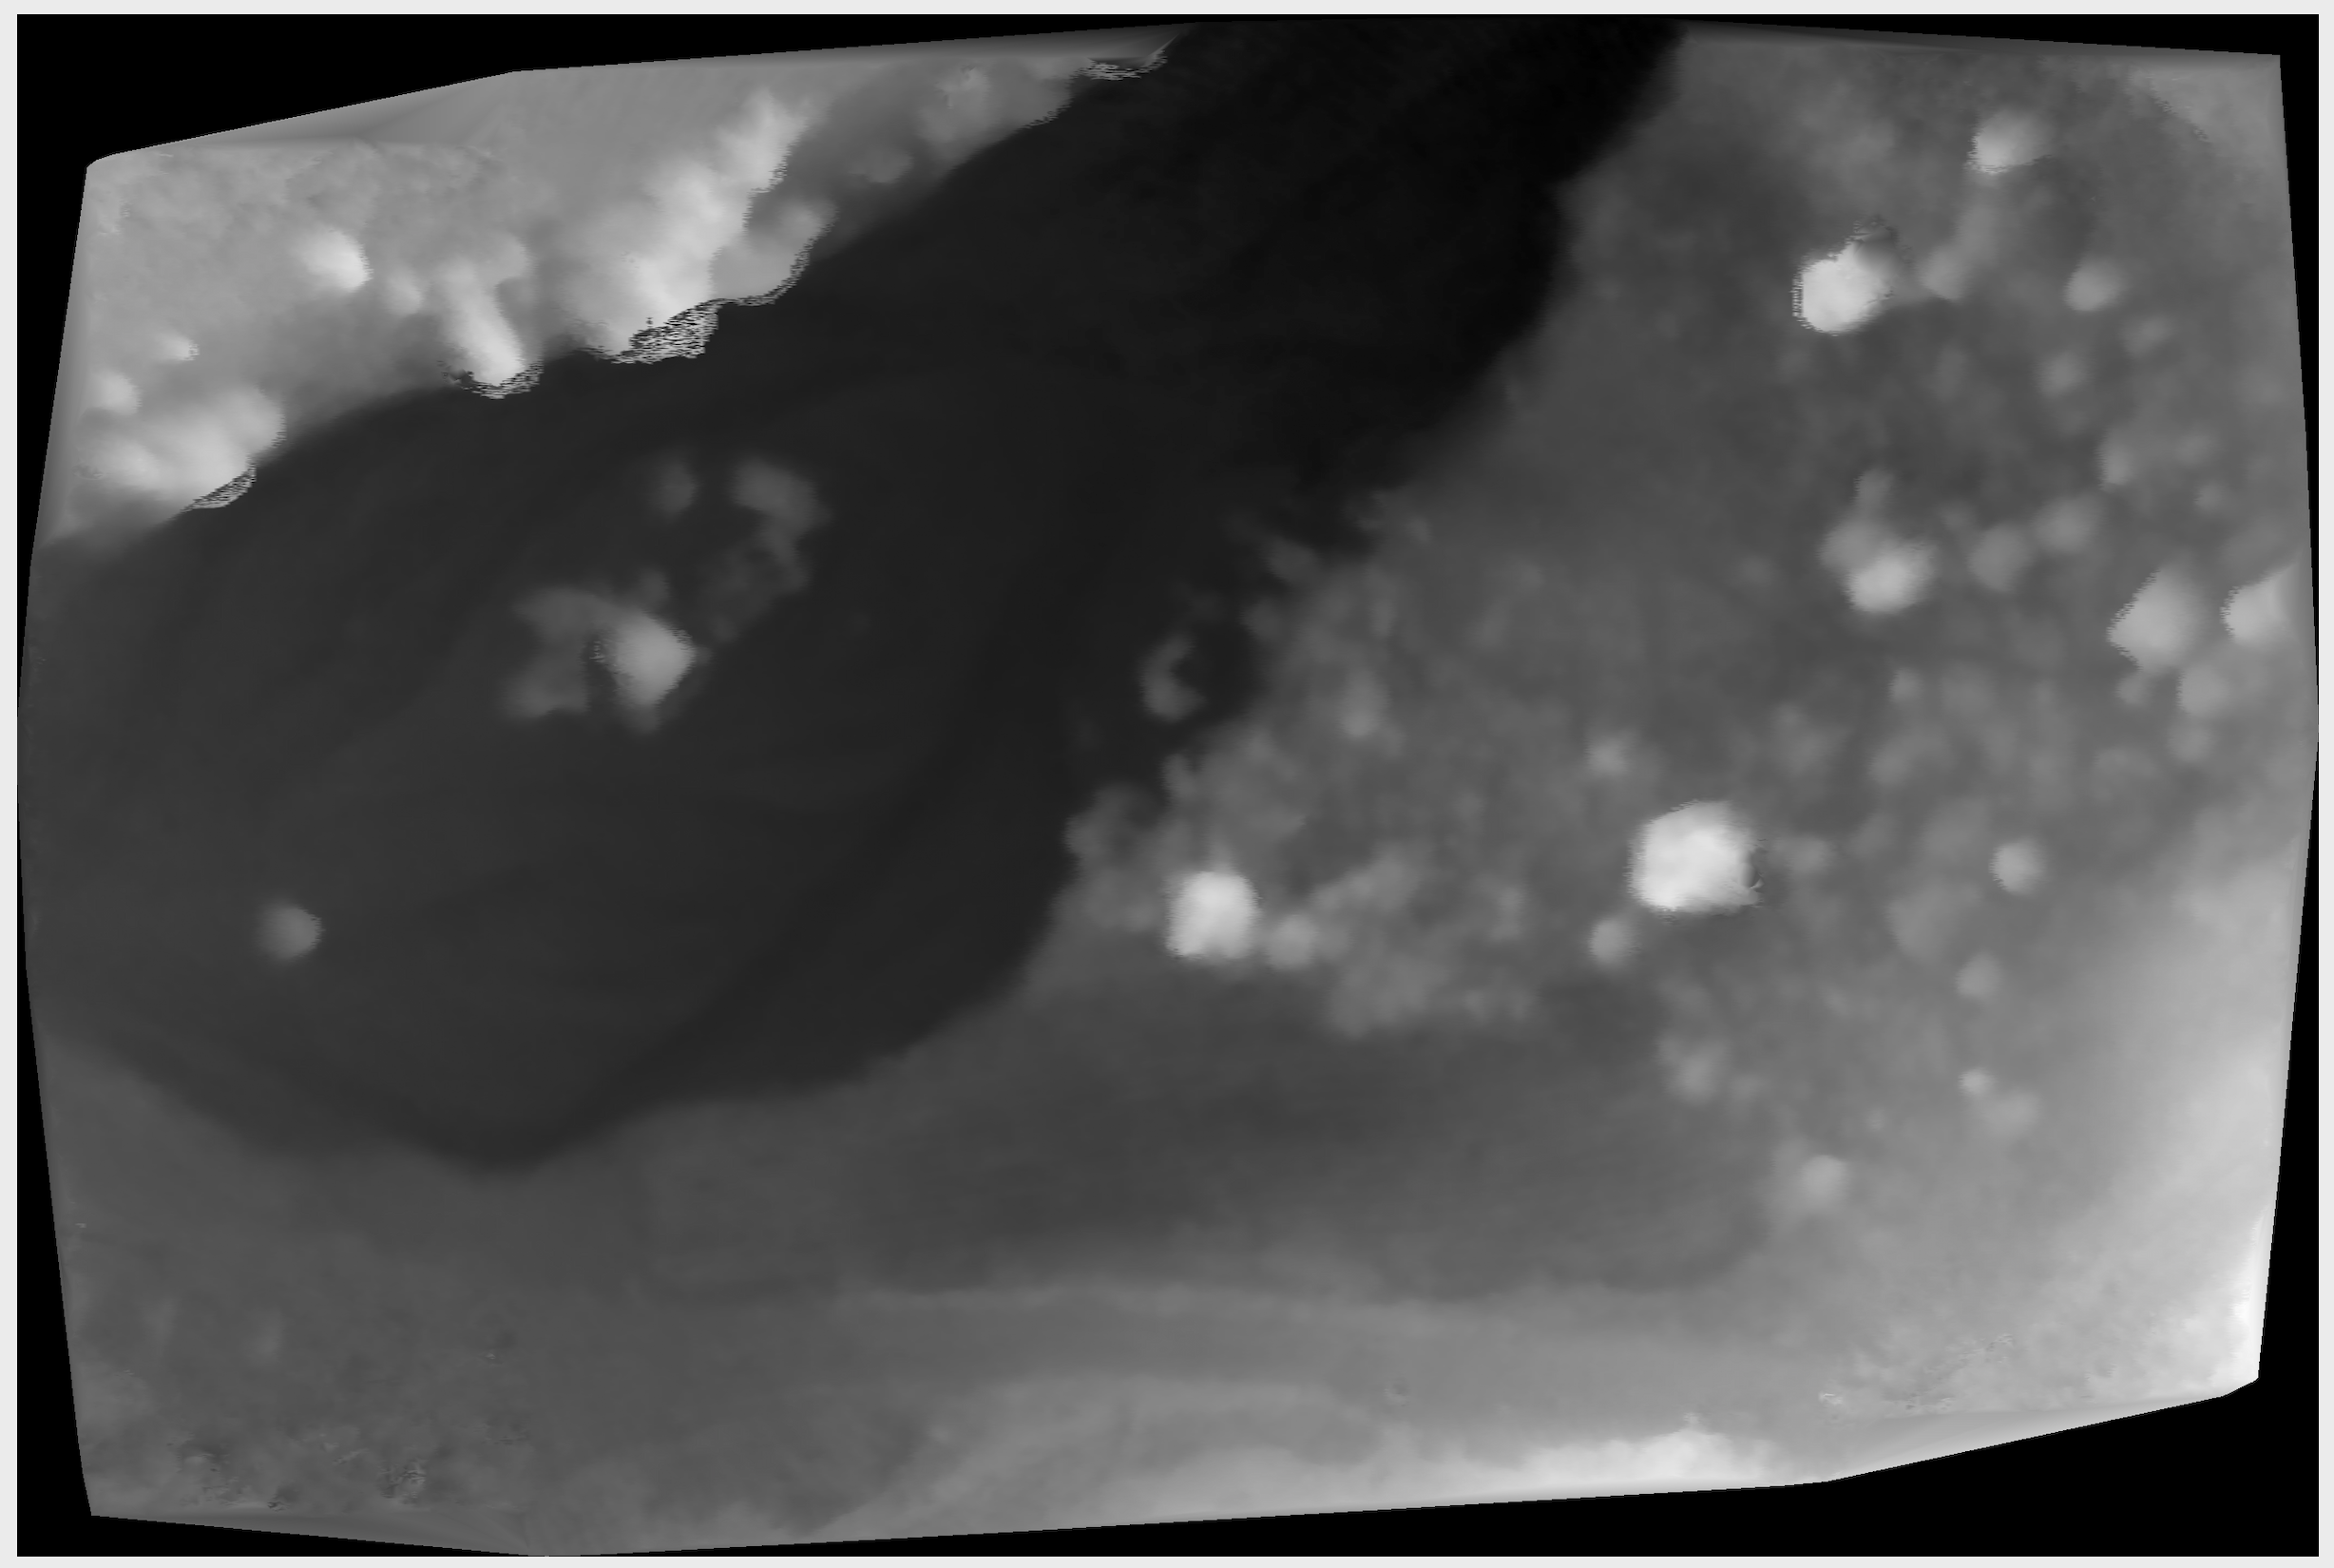
Here is the grayscale elevation image generated.
![enter image description here]()
Lastly, my question has been solved basically. Please comment on this post if you have any good ideas or confusion. Thanks all!
Rowen


pcolormeshplotting function from Matplotlib would be a good fit for your use case. – Interpolate