Change the marker thickness in matplotlib scatter plot
Asked Answered
P

1

5

I have the following marker in my python matplotlib scatter plot:

enter image description here

made by the code:

plt.scatter(x,y,c=z,cmap=cm.bwr,marker='X',s=800,linewidth=1,edgecolor='k')

I want the X to be the same size, but I want the red part to be 'thinner'. More like a real 'X' I guess.

Is this possible?

Thank you.

Pyrrhotite answered 1/5, 2019 at 1:56 Comment(0)
L
11

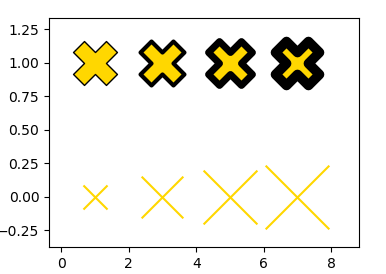
The thicker the edge, the thinner the face. Alternatively a marker "x" can be used

import matplotlib.pyplot as plt


for lw in [1,3,5,7]:
    plt.scatter([lw], [1], c="gold", s=1000, marker="X", 
                linewidth=lw, edgecolor='k')
    plt.scatter([lw], [0], c="gold", s=lw*300, marker="x")

plt.margins(.2)
plt.show()

enter image description here

Linet answered 1/5, 2019 at 2:13 Comment(2)
I've asked 3 questions tonight and you've answered all of them. Thank you! :)Pyrrhotite
Ok... so i spend today 1 hour because i was using a lower 'x' instead of 'X'... Thank you a lot for your answer!Alienee

© 2022 - 2024 — McMap. All rights reserved.