I am not sure if there is a clean solution for this in plotly.express. Since plotly.express creates a plotly.graph_object anyway, they both will only recognize gaps if there is a '' or NaN in the y-values being considered (according to this forum post).
This means we will need to copy the y-values to different two different columns, and replace True with NaN in one column, and replace False with NaN in the other column. Then we can use go.Scatter to plot 'Datum' against each of the new columns.
Sample df:
df = pd.DataFrame({
    'Datum':pd.date_range('2021-01-01 00:00:01', '2021-01-01 00:00:20', freq="s"),
    'Erzeugung_Gesamt': list(range(1,21)),
    'EE>100%': ['True']*4+['False']*4+['True']*4+['False']*4+['True']*4
})
This should look similar to your df if I understood your question correctly:
>>> df
                 Datum  Erzeugung_Gesamt  EE>100%
0  2021-01-01 00:00:01                 1     True
1  2021-01-01 00:00:02                 2     True
2  2021-01-01 00:00:03                 3     True
3  2021-01-01 00:00:04                 4     True
4  2021-01-01 00:00:05                 5    False
5  2021-01-01 00:00:06                 6    False
6  2021-01-01 00:00:07                 7    False
7  2021-01-01 00:00:08                 8    False
8  2021-01-01 00:00:09                 9     True
9  2021-01-01 00:00:10                10     True
10 2021-01-01 00:00:11                11     True
11 2021-01-01 00:00:12                12     True
12 2021-01-01 00:00:13                13    False
13 2021-01-01 00:00:14                14    False
14 2021-01-01 00:00:15                15    False
15 2021-01-01 00:00:16                16    False
16 2021-01-01 00:00:17                17     True
17 2021-01-01 00:00:18                18     True
18 2021-01-01 00:00:19                19     True
19 2021-01-01 00:00:20                20     True
To add the two new Erzeugung_Gesamt columns to the df (based on whether EE>100% is 'True' or 'False'):
df['Erzeugung_Gesamt_true_with_gaps'] = df['Erzeugung_Gesamt'].values
df['Erzeugung_Gesamt_false_with_gaps'] = df['Erzeugung_Gesamt'].values

## for Erzeugung_Gesamt_true_gaps we replace False with NaN
## for Erzeugung_Gesamt_false_gaps we replace True with NaN
df.loc[df['EE>100%'] == 'False','Erzeugung_Gesamt_true_with_gaps'] = float("nan")
df.loc[df['EE>100%'] == 'True','Erzeugung_Gesamt_false_with_gaps'] = float("nan")
Updated df:
>>> df
                 Datum  Erzeugung_Gesamt EE>100%  Erzeugung_Gesamt_true_with_gaps  Erzeugung_Gesamt_false_with_gaps
0  2021-01-01 00:00:01                 1    True                              1.0                               NaN
1  2021-01-01 00:00:02                 2    True                              2.0                               NaN
2  2021-01-01 00:00:03                 3    True                              3.0                               NaN
3  2021-01-01 00:00:04                 4    True                              4.0                               NaN
4  2021-01-01 00:00:05                 5   False                              NaN                               5.0
5  2021-01-01 00:00:06                 6   False                              NaN                               6.0
6  2021-01-01 00:00:07                 7   False                              NaN                               7.0
7  2021-01-01 00:00:08                 8   False                              NaN                               8.0
8  2021-01-01 00:00:09                 9    True                              9.0                               NaN
9  2021-01-01 00:00:10                10    True                             10.0                               NaN
10 2021-01-01 00:00:11                11    True                             11.0                               NaN
11 2021-01-01 00:00:12                12    True                             12.0                               NaN
12 2021-01-01 00:00:13                13   False                              NaN                              13.0
13 2021-01-01 00:00:14                14   False                              NaN                              14.0
14 2021-01-01 00:00:15                15   False                              NaN                              15.0
15 2021-01-01 00:00:16                16   False                              NaN                              16.0
16 2021-01-01 00:00:17                17    True                             17.0                               NaN
17 2021-01-01 00:00:18                18    True                             18.0                               NaN
18 2021-01-01 00:00:19                19    True                             19.0                               NaN
19 2021-01-01 00:00:20                20    True                             20.0                               NaN
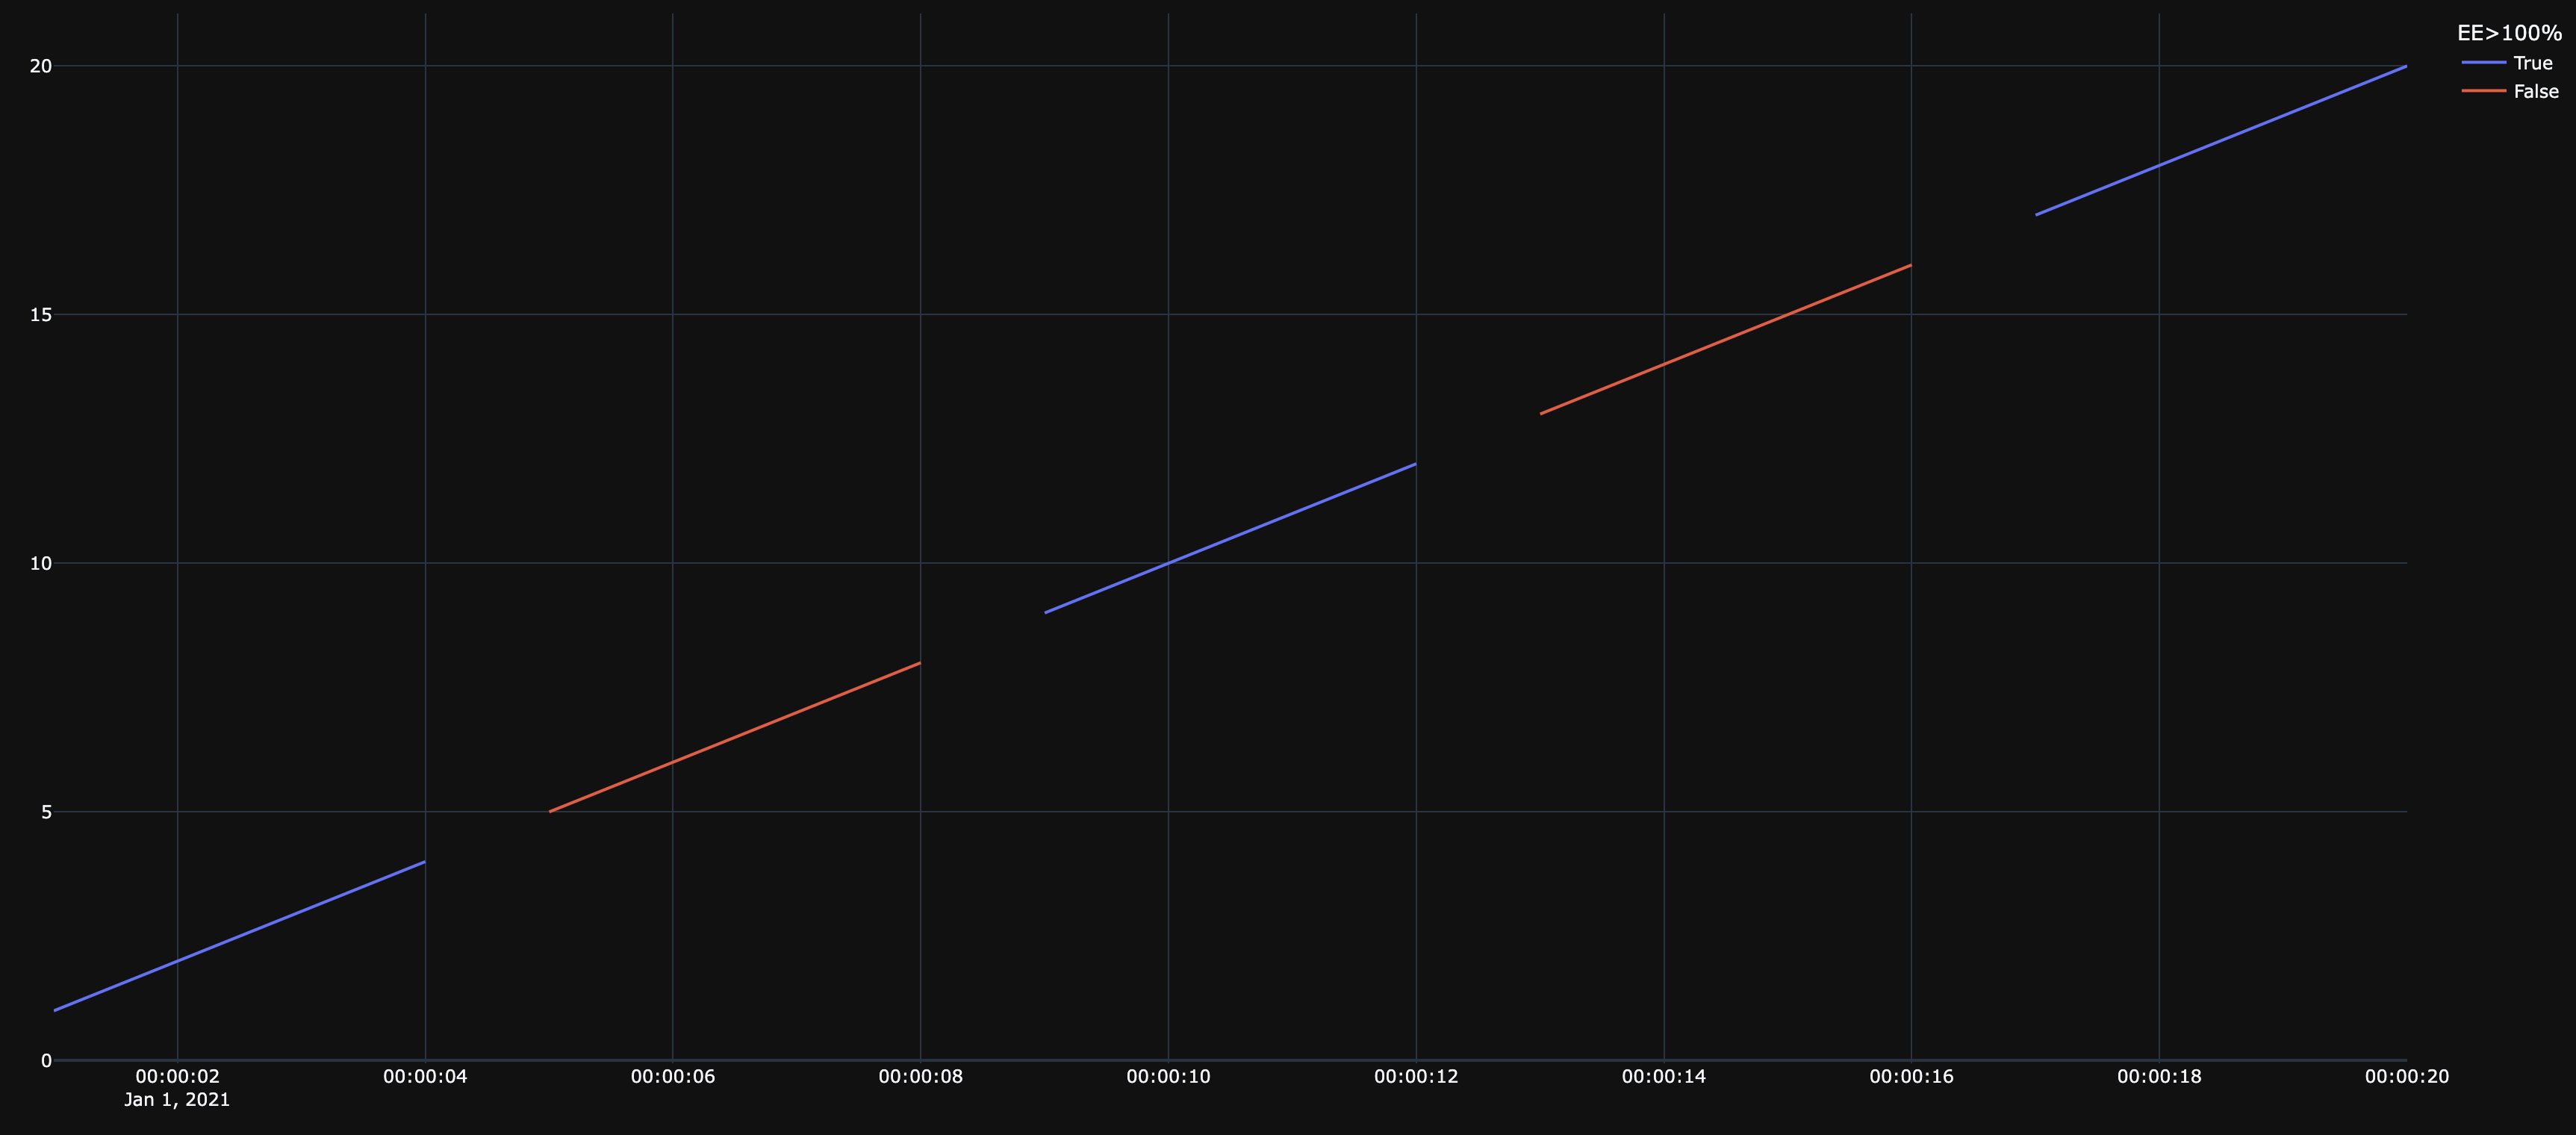
Now using go.Figure and add_traces we can add the two new columns one at a time:
fig = go.Figure()

fig.add_trace(go.Scatter(x=df['Datum'], y=df['Erzeugung_Gesamt_true_gaps'], mode='lines', name=True))
fig.add_trace(go.Scatter(x=df['Datum'], y=df['Erzeugung_Gesamt_false_gaps'], mode='lines', name=False))
fig.update_layout(legend_title='EE>100%')
The figure renders like this:
![enter image description here]()
To incorporate this into your figure generating function:
def drawEE_absolute():
    fig = go.Figure()

    fig.add_trace(go.Scatter(x=df['Datum'], y=df['Erzeugung_Gesamt_true_with_gaps'], mode='lines', name="True"))
    fig.add_trace(go.Scatter(x=df['Datum'], y=df['Erzeugung_Gesamt_false_with_gaps'], mode='lines', name="False"))
    fig.update_layout(legend_title='EE>100%', template='plotly_dark')

    return html.Div([
        dbc.Card(
            dbc.CardBody([
                dcc.Graph(
                    figure=fig,
                    config={
                        'displayModeBar': True,
                        'toImageButtonOptions': {
                            'filename': 'custom_image',
                            'height': None,
                            'width': None,
                        }
                    }
                )
            ])
        ),
    ])


