I just installed a Windows 10 machine, since Windows 7 is now dropped... along with the old, classic VC6. Plus the Service pack 6, and the Platform SDK installed. I have been using it this way with no issues on my Windows 7 machine for decades (too long to go into why not upgrade to VS 2010, 2012, 2015, 2017, 2019, yada yada, yada... Subject for a different debate)
I brought up an existing project I was working in before the end of the year. Big exe, several DLLs in it, C++ objects, etc... Was all working fine before Jan 1st.
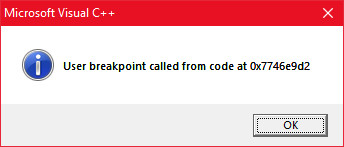
On my new Windows 10 install, when I tried to launch it in the debugger, it gave an error:
This appears even before main is called. And the executable immediately exists, even before the message box appears, so there is no stack trace to examine. Naturally I looked for any C++ constructors that might be called which could be corrupting things. But there were none. (and never had any issues on my Windows 7 machine anyway)
I narrowed it to the following condition: The main EXE is linked statically to a LIB/DLL. THAT dll is linked statically to another LIB/DLL When I remove the underneath DLL dependency, I can run the executable in the debugger.
I've found several projects that are experiencing this.
I have a test project (dsw and dps files) which demonstrates this (at least on my Windows 10 machine) if anyone wants to look at it. It is stripped down to nothing but shells. An EXE that is linked to a DLL, which is linked to another DLL. If I remove the inner DLL dependency in the link stage, the executable with a single DLL work fine.
Also, the EXE will run outside the debugger as well. Both debug and release.
Lastly, when I set the configuration for release, it also runs in the IDE, but has no debug info. However if I enable debug info in the release builds, it again crashes before startup.
So apparently there is yet something in windows 10 that is preventing the debugging container from running. I have also disabled the "Fault Tolerant Heap Shim" but no change.
Has anyone experienced something like this?
Does anyone have any advice?
-Scotty

