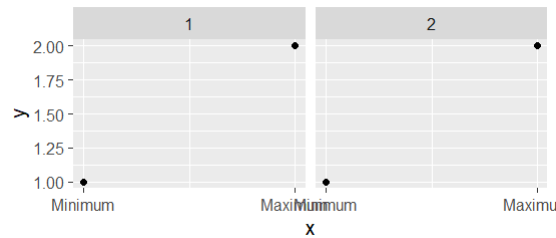
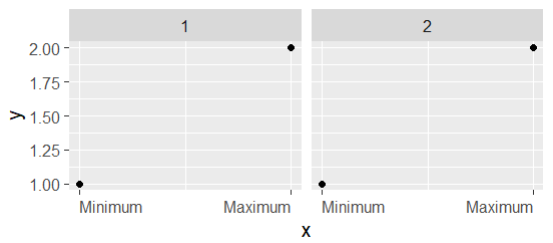
I often find myself wanting to align the x-axis labels on my plots differently based on their location, with values on the left left-aligned and values on the right, right-aligned. However, element_text doesn't have official support for vectorized input (and never will?) so I'm wondering how to solve this in proper ggplot2 fashion.
The problem: overlapping x-axis labels (and truncated on the far right)
library(ggplot2)
v <- data.frame(x=1:2, y=1:2, facet=gl(2, 2))
gp <- ggplot(v) +
  geom_point(aes(x=x, y=y)) +
  scale_x_continuous(breaks = 1:2, labels = c("Minimum", "Maximum")) +
  facet_wrap(~facet)
gp
My solution:
gp + theme(axis.text.x = element_text(hjust=c(0, 1)))
Except:
Warning message:
Vectorized input to `element_text()` is not officially supported.
ℹ Results may be unexpected or may change in future versions of ggplot2.
What's the correct way to differently-align text in a ggplot if vectorized element_text isn't supported?


ggplot2crew's vision for how this should go. Is it just a bad idea in general because the labels are offset from the ticks? It seems like it's just a technical problem, so is it worth opening a feature request on the GitHub even though they already seem aware this is an edge case? – Repudiate