How to change the colorbar ticklabels to percent
Asked Answered
G

1

2

I have a problem with the colorbar of my kdeplot. It should show the percentage in each bin starting with 0%. I tried two different ways, but both visualizations are not exactly what I need.

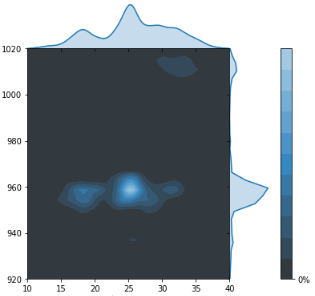
kdeplot with JointGrid

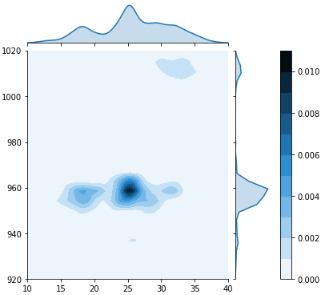
kdeplot with jointplot

The version with JointGrid starts indeed with 0%, but doesn't show the other values for each color. Furthermore I need the "background" to be white or at least bright (not black, but shaded).

The version with jointplot shows the values for each color, but not in percentage.

Here is the code I used to create the visualizations:

import numpy as np
import pandas as pd
import matplotlib.pyplot as plt
import seaborn as sns


x = np.random.normal(np.tile(np.random.uniform(-5, 35, 10), 1000), 4)
y = np.random.normal(np.tile(np.random.uniform(910, 1030, 10), 1000), 4)
data = pd.DataFrame(x,y)
1

g = sns.JointGrid(x, y, data=data, space=0, xlim=[10,40], ylim=[920,1020])
g = g.plot_joint(sns.kdeplot, cmap="Blues_d", shade=True, cbar=True, cbar_kws= 
{'format':'%.0f%%','ticks': [0, 100]})
g = g.plot_marginals(sns.kdeplot, shade=True)

plt.subplots_adjust(left=0.1, right=0.8, top=0.9, bottom=0.1)
pos_joint_ax = g.ax_joint.get_position()
pos_marg_x_ax = g.ax_marg_x.get_position()
g.ax_joint.set_position([pos_joint_ax.x0, pos_joint_ax.y0, pos_marg_x_ax.width, pos_joint_ax.height])
g.fig.axes[-1].set_position([.83, pos_joint_ax.y0, .07, pos_joint_ax.height])

plt.show()
2

kdeplot = sns.jointplot(x, y, kind="kde", cbar=True, xlim=[10,40], ylim=[920,1020])

plt.subplots_adjust(left=0.1, right=0.8, top=0.9, bottom=0.1)
pos_joint_ax = kdeplot.ax_joint.get_position()
pos_marg_x_ax = kdeplot.ax_marg_x.get_position()
kdeplot.ax_joint.set_position([pos_joint_ax.x0, pos_joint_ax.y0, pos_marg_x_ax.width, 
pos_joint_ax.height])
kdeplot.fig.axes[-1].set_position([.83, pos_joint_ax.y0, .07, pos_joint_ax.height])

plt.show()
Garrygarson answered 31/3, 2020 at 9:16 Comment(0)
L
2

To get the colors in reverse order (light for small values, dark for high values), change cmap="Blues_d" to cmap="Blues". (Note that sns.kdeplot also has an option shade_lowest= which can be set to False.)

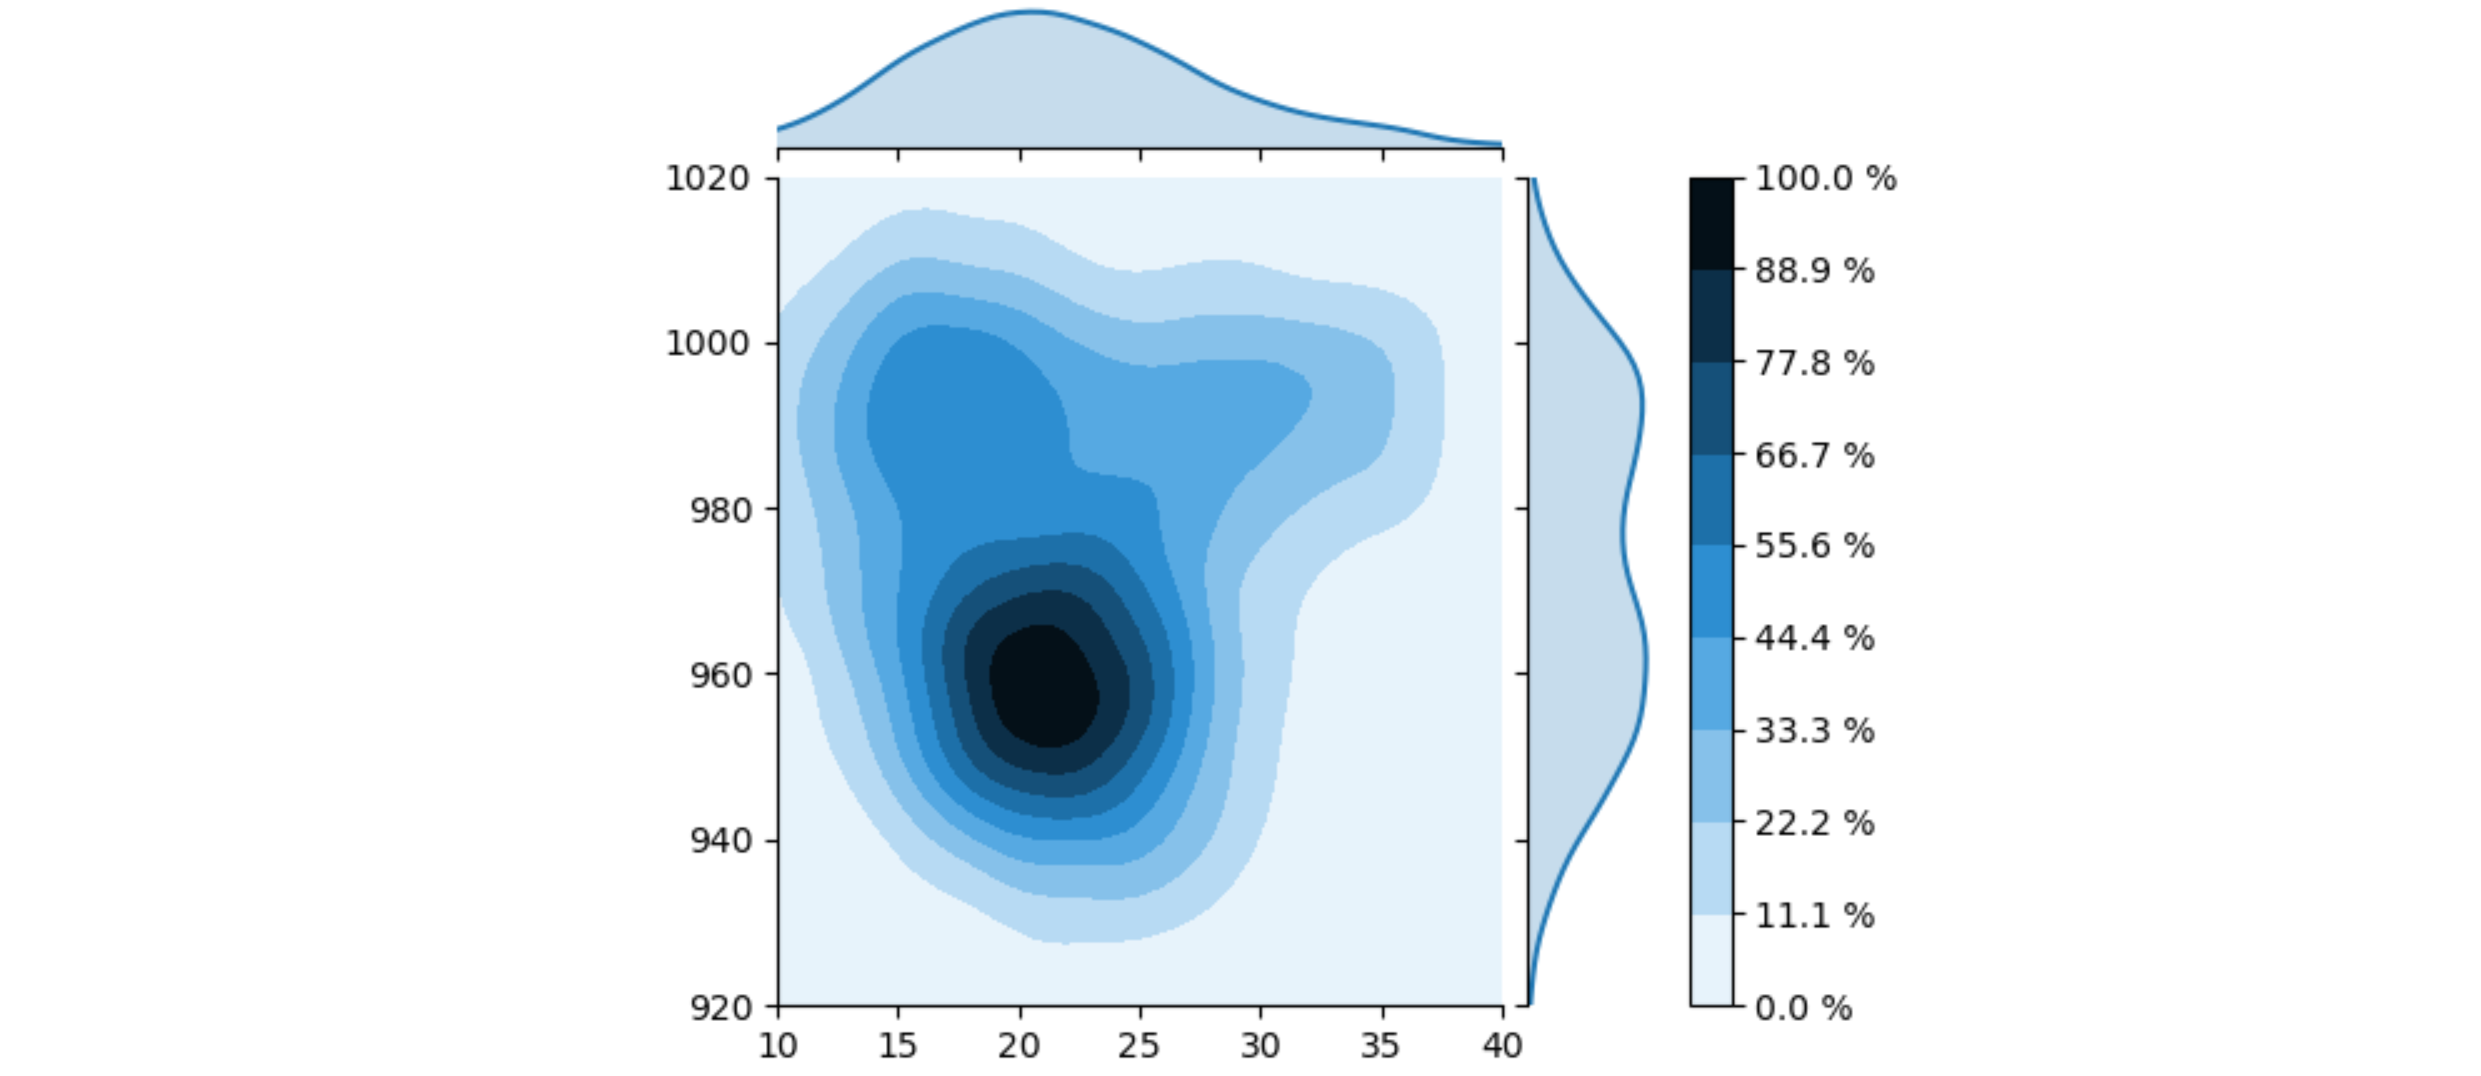
The colorbar ticks seem to be fixed at the borders between each value. I couldn't find a way to replace the ticks, but changing their labels can be done. By dividing the tick value by their maximum and multiplying by 100% a percentage can be obtained. However, these are not at nice values for a scale from 0 to 100.

import numpy as np
import pandas as pd
import matplotlib.pyplot as plt
import seaborn as sns

x = np.random.normal(np.tile(np.random.uniform(15, 35, 10), 1000), 4)
y = np.random.normal(np.tile(np.random.uniform(940, 1000, 10), 1000), 10)

kdeplot = sns.jointplot(x, y, kind="kde", cbar=True, xlim=[10, 40], ylim=[920, 1020])

plt.subplots_adjust(left=0.1, right=0.8, top=0.9, bottom=0.1)
pos_joint_ax = kdeplot.ax_joint.get_position()
pos_marg_x_ax = kdeplot.ax_marg_x.get_position()
kdeplot.ax_joint.set_position([pos_joint_ax.x0, pos_joint_ax.y0, pos_marg_x_ax.width,
                               pos_joint_ax.height])
kdeplot.fig.axes[-1].set_position([.83, pos_joint_ax.y0, .07, pos_joint_ax.height])

# get the current colorbar ticks
cbar_ticks = kdeplot.fig.axes[-1].get_yticks()
# get the maximum value of the colorbar
_, cbar_max = kdeplot.fig.axes[-1].get_ylim()
# change the labels (not the ticks themselves) to a percentage
kdeplot.fig.axes[-1].set_yticklabels([f'{t / cbar_max * 100:.1f} %' for t in cbar_ticks])

plt.show()

sample plot

Lueluebke answered 1/4, 2020 at 0:43 Comment(4)
Thanks a lot for helping me again, JohanC! The problem is, that it looks really nice now, but I think the content is wrong.Garrygarson
The darkest color represents 100% now and exactly that color is used in the center of the visualization. But that doesn't make sense, right? Because if all the data would be in one bin, we would see a black dot. Looking at the second pic I plotted, the darkest color represents 0.01, so 1%. The point I want to make is, that the cbar should show the values in percentage but shouldn't end with 100%. Do you know what I mean?Garrygarson
How do you want to interpret the percentage? Now it is a percentage of the maximum height if you pretend the plot is a height map of a 2d region. I don't know how to obtain the area nor the volume.Lueluebke
I thought a lot about it and I think that the colorbar is maybe not the right way to do it. I probably need the percentage for each contour line. So that I can make a statement like this "The dark blue cloud, the center, contains 10% of the datapoints and 50% of the datapoints are covered by the third biggest cloud". Sorry for the complicated description, I don't really know how to put it in words.Garrygarson

© 2022 - 2024 — McMap. All rights reserved.