I am plotting the netCDF file available here: https://goo.gl/QyUI4J
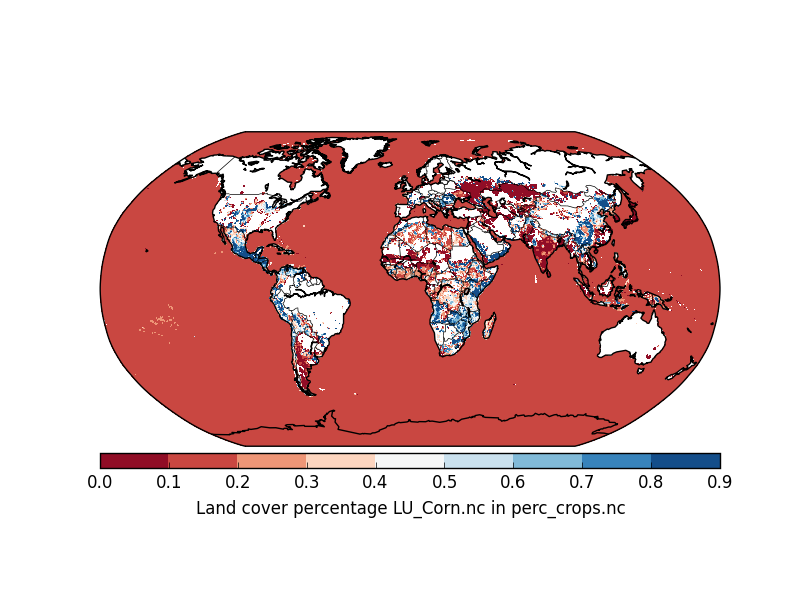
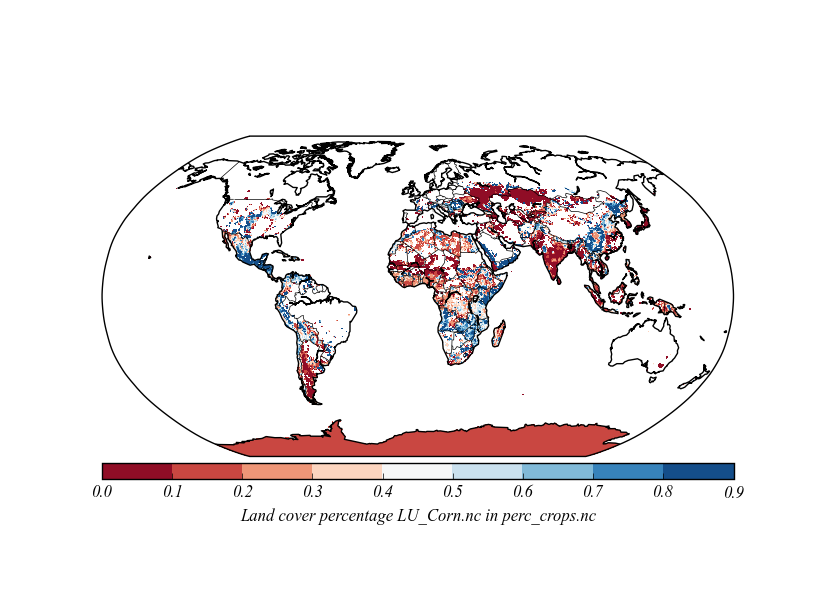
Using the code below, the map looks like this:

However, I want the oceans to be in white color. Better still, I want to be able to specify what color the oceans show up in. How do I change the code below to do that? Right now, the issue is that the oceans are getting plotted on the data scale. (please note that the netCDF file is huge ~3.5 GB).
import pdb, os, glob, netCDF4, numpy
from matplotlib import pyplot as plt
from mpl_toolkits.basemap import Basemap

def plot_map(path_nc, var_name):
    """
    Plot var_name variable from netCDF file
    :param path_nc: Name of netCDF file
    :param var_name: Name of variable in netCDF file to plot on map
    :return: Nothing, side-effect: plot an image
    """

    nc = netCDF4.Dataset(path_nc, 'r', format='NETCDF4')
    tmax  = nc.variables['time'][:]

    m = Basemap(projection='robin',resolution='c',lat_0=0,lon_0=0)

    m.drawcoastlines()
    m.drawcountries()

    # find x,y of map projection grid.
    lons, lats = get_latlon_data(path_nc)
    lons, lats = numpy.meshgrid(lons, lats)
    x, y = m(lons, lats)
    nc_vars = numpy.array(nc.variables[var_name])

    # Plot!
    m.drawlsmask(land_color='white',ocean_color='white')
    cs = m.contourf(x,y,nc_vars[len(tmax)-1,:,:],numpy.arange(0.0,1.0,0.1),cmap=plt.cm.RdBu)

    # add colorbar
    cb = m.colorbar(cs,"bottom", size="5%", pad='2%')
    cb.set_label('Land cover percentage '+var_name+' in '+os.path.basename(path_nc))

    plt.show()


plot_map('perc_crops.nc','LU_Corn.nc')


get_latlon_data? – Gandy