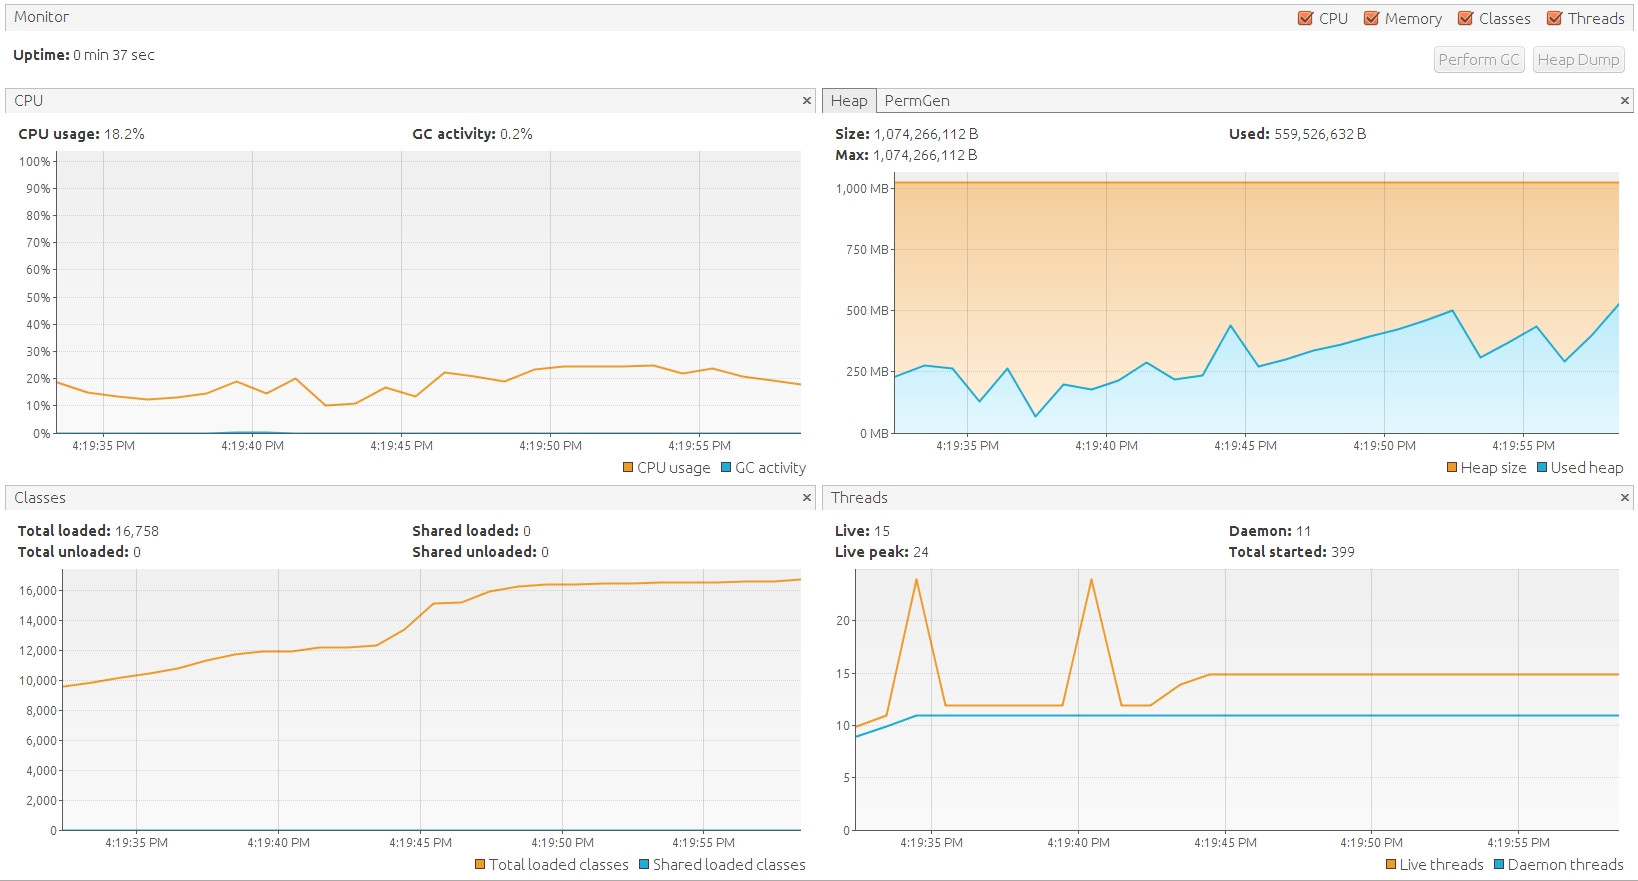
All this information is available through JMX. That's how VisualVM gets the information and you can use the same technology to get it too. First install the VisualVM-MBeans plugin from the Tools menu. This will add another tab titled MBeans where you can see all the available data for your application. You will find the graphed data under java.lang.Memory and java.lang.OperationSystem.
If you're trying to check information for your own process, it's as simple as calling ManagementFactory.getOperatingSystemMXBean().getSystemLoadAverage() and ManagementFactory.getMemoryMXBean().getHeapMemoryUsage(). There are more, but these should get you started.
To get precise CPU usage see: Using OperatingSystemMXBean to get CPU usage
If you want to get information on another process, you'd need some more code. There is a complete answer on Accessing a remote MBean server but basically:
// replace host and port
// not tested, might not work
JMXServiceURL url = new JMXServiceURL("service:jmx:rmi:///jndi/rmi://<addr>:<port>");
JMXConnector jmxConnector = JMXConnectorFactory.connect(url);
MBeanServerConnection connection = jmxConnector.getMBeanServerConnection();
OperatingSystemMXBean bean = ManagementFactory.getPlatformMXBean(connection, OperatingSystemMXBean.class);
bean.getSystemLoadAverage();
You will also have to start your Java process with exposed JMX as explained on How to activate JMX on my JVM for access with jconsole? but basically:
-Dcom.sun.management.jmxremote
-Dcom.sun.management.jmxremote.port=9010
-Dcom.sun.management.jmxremote.local.only=false
-Dcom.sun.management.jmxremote.authenticate=false
-Dcom.sun.management.jmxremote.ssl=false
There is also a way to enumerate Java processes running on the local machine and even connect to processes that don't have JMX enabled (though you get less data). If that's what you're looking for, VisualVM Source Code will be a good place to start.

