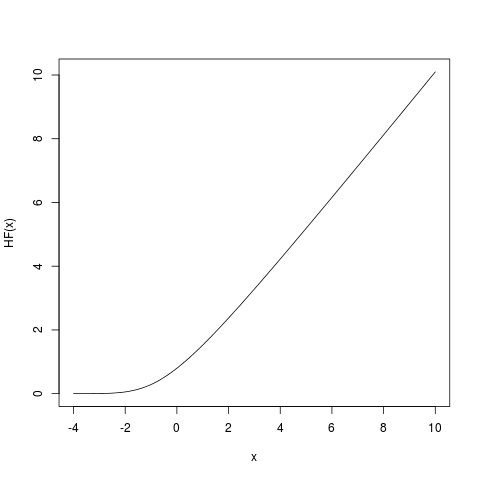
Based on formulas given in the Mathematica UUPDE database I've plotted the hazard function for the standard normal distribution in R.
It seems to be correct in certain range; the numerical issues occur for larger values, see attached figure. Below is the complete R code.
Any comments would be very appreciated.

PDF = function(x) {  1/(sqrt(2*pi))*exp(-x^2/2) }
erf <- function(x) 2 * pnorm(x * sqrt(2)) - 1
erfc <- function(x) 2 * pnorm(x * sqrt(2), lower = FALSE)
CDF = function(x) {  1/2 * (1 + erf(x/(sqrt(2)))) }
HF = function(x) { sqrt(2/pi)/(exp(x^2/2)*(2-erfc(-x/sqrt(2)))) }
SF = function(x) { 1 - 1/2 *erfc(-x/sqrt(2)) }

par(mar=c(3,3,1.5,0.5), oma=c(0,0,0,0), mgp=c(2,1,0))
par(mfrow = c(2, 2))

x = seq(from = -4,to = 10,by = .001)

##### PDF
a = PDF(x)
plot(x,a,'l',main='',ylab="PDF",xlab="x")
grid(nx = NULL,ny = NULL,col = "grey",lty = "dotted",lwd = par("lwd"),equilogs = TRUE)

##### CDF
a = CDF(x)
plot(x,a,'l',main='',ylab="CDF",xlab="x")
grid(nx = NULL,ny = NULL,col = "grey",lty = "dotted",lwd = par("lwd"),equilogs = TRUE)

##### HF
a = HF(x)
plot(x,a,'l',main='',ylab="HF",xlab="x")
grid(nx = NULL,ny = NULL,col = "grey",lty = "dotted",lwd = par("lwd"),equilogs = TRUE)

##### SF
a = SF(x)
plot(x,a,'l',main='',ylab="SF",xlab="x")
grid(nx = NULL,ny = NULL,col = "grey",lty = "dotted",lwd = par("lwd"),equilogs = TRUE)

